


1. žĄú Ž°†
2010ŽÖĄ žĚīŪõĄ ÍłįŪõĄŽ≥ÄŪôĒ ŽďĪžĚė žėĀŪĖ•žúľŽ°ú ŪŹ≠žöį, ŪÉúŪíćžúľŽ°ú žĚłŪēú žĻ®žąėŪĒľŪēīÍįÄ ŽĻąŽ≤ąŪēėÍ≤Ć ŽįúžÉĚŪēėÍ≥† žěąŽč§. ŽŹĄžčúžßÄžó≠žóźžĄúŽäĒ žčúÍįĄŽčĻ 30 mm žĚīžÉĀžĚė Íįēžöį ŽįúžÉĚ ŪöüžąėÍįÄ 1990ŽÖĄŽĆÄžôÄ ŽĻĄÍĶźŪĖąžĚĄ ŽēĆ ÍłČÍ≤©ŪēėÍ≤Ć ž¶ĚÍįÄŪĖąžúľŽ©į, Ž∂ąŪą¨žąėŽ©īž†ĀžĚė ž¶ĚÍįÄ, žčúÍįÄžßÄŽāī žĻėžąėžčúžĄ§ Ūôēž∂©žĚė ŪēúÍ≥Ą ŽďĪžúľŽ°ú žĻ®žąėŪĒľŪēī ŽįúžÉĚ žúĄŪóėžĚī žĽ§žßą Í≤ÉžúľŽ°ú žėąžł°ŽźúŽč§(Han, 2018). ž†ēŽ∂Ğ󟞥úŽäĒ ŪôćžąėŪĒľŪēī ŽįúžÉĚžúĄŪóėžĚĄ žā¨ž†Ąžóź ŪĆĆžēÖŪēėÍ≥† ŪĒľŪēīŽįúžÉ̞̥ žėąŽį©ŪēėÍ≥†žěź 1998ŽÖĄŽ∂ÄŪĄį žě¨ŪēīžėąŽį©žā¨žó̥֞ žčúŪĖČŪēėÍ≥† žěąžúľŽ©į ÍįúŽ≥Ąžā¨žóÖžĚė ž§ĎžöĒŽŹĄŽ•ľ ŪŹČÍįÄŪēėŽäĒ Ūą¨žěźžöįžĄ†žąúžúĄ Ž∂ĄžĄĚžĚĄ Íłįž§ÄžúľŽ°ú Žč®Í≥Ąž†ĀžúľŽ°ú žā¨žó̥֞ žč§žčúŪēėÍ≥† žěąŽč§(Kim et al., 2012). Ūą¨žěźžöįžĄ†žąúžúĄ Ž∂ĄžĄĚžóź ŪŹ¨Ūē®ŽźėŽäĒ žĄłŽ∂ÄŪē≠Ž™©žúľŽ°úŽäĒ Í≤Ĺž†úžĄĪ ŪŹČÍįÄŽ™®ŪėēžĚĄ Ūôúžö©Ūēú ŽĻĄžö©ŪéłžĚĶ(B/C, Benefit/Cost) Ž∂ĄžĄĚžĚī žěąžúľŽ©į, ÍĶ≠ŽāīŽ•ľ ŪŹ¨Ūē®Ūēėžó¨ ŪēīžôłžóźžĄúŽŹĄ Žč§žĖĎŪēú žĻėžąėÍīÄŽ†® Í≤Ĺž†úžĄĪ ŪŹČÍįÄŽ™®ŪėēžĚĄ žā¨žö©ŪēėÍ≥† žěąŽč§.
ŽĮłÍĶ≠žóźžĄúŽäĒ žóįŽį©žě¨ŽāúÍīÄŽ¶¨ž≤≠(FEMA)žóźžĄú Hazards U.S. Multi-Hazard (Hazus-MH)ŽĚľŽäĒ žě¨Žāú žÜźžč§ ŪŹČÍįÄ žÜĆŪĒĄŪäłžõ®žĖīŽ•ľ žā¨žö©Ūēėžó¨ ŪôćžąėŽ°ú ŽįúžÉĚŪēėŽäĒ žßĀž†Ď Ž¨ľŽ¶¨ž†Ā ŪĒľŪēī, žßĀž†Ď žā¨ŪöĆÍ≤Ĺž†úž†Ā žÜźžč§, ÍįĄž†Ď Í≤Ĺž†úž†Ā žÜźžč§žĚĄ žāįž†ēŪēėÍ≥† žěąŽč§. žó¨ÍłįžĄú ÍįĄž†Ď Í≤Ĺž†úž†Ā žÜźžč§žĚÄ žě¨Žāúžóź žĚėŪēú Ūą¨žěÖ-žāįž∂ú ŪĚźŽ¶ĄžĚė Ž≥ÄŪôĒŽ°ú ŽįúžÉĚŪēėŽäĒ žÜźžč§žĚīŽ©į, Í≤Ĺž†ú ÍłįŽä•žĚė žĚīžÉĀžúľŽ°ú ŽįúžÉĚŪēėŽäĒ ž∂ĒÍįÄ žÜźžč§žĚĄ žĚėŽĮłŪēúŽč§(Yu and An, 2013; Hyun and Kim, 2018).
žĚľŽ≥ł ÍĶ≠Ū܆ÍĶźŪÜĶžĄĪ(Ministry of Land, Infrastructure, Transport and Tourism, MLIT)žóźžĄú ŽįúÍįĄŪēú žĻėžąėÍ≤Ĺž†úž°įžā¨Žß§ŽČīžĖľ(2005)žóźžĄúŽäĒ žßĀž†ĎŪĒľŪēīžôÄ ÍįĄž†ĎŪĒľŪēīŽ°ú ÍĶ¨Ž∂ĄŪēėžó¨ žĻ®žąė ŪĒľŪēīŽ°ú ŽįúžÉĚŪēėŽäĒ ŪĒľŪēīžē°žĚĄ žāįž†ēŪēėžėÄŽč§. žĚīž§Ď ÍįĄž†ĎŪĒľŪēīžĚė Í≤Ĺžöį ÍĶźŪÜĶ ŽĎźž†ąžóź ŽĒįŽ•ł ŪĆĆÍłČŪĒľŪēī, ŽĚľžĚīŪĒĄŽĚľžĚł žÜźžÉĀžóź ŽĒįŽ•ł ŪĆĆÍłČŪĒľŪēī, žĚĎͳȎĆÄžĪÖŽĻĄžö© ŽďĪžĚĄ ž†úžčúŪēėžó¨ Íłįž°ī Í≤Ĺž†úžĄĪ ŪŹČÍįÄŽ™®ŪėēžóźžĄú Žč§Ž£®žßÄ žēäžĚÄ ÍįĄž†ĎŪĒľŪēī žāįž†ēŽį©Ž≤ēŽ°†žĚĄ ž†úžčúŪēėÍ≥† žěąŽč§(MLIT, 2005).
ÍĶ≠ŽāīžóźžĄúŽäĒ ŪėĄžě¨ ÍįĄŪ鳎≤ē, ÍįúžĄ†Ž≤ē, Žč§žį®žõź ŪôćžąėŪĒľŪēī žāįž†ēŽ≤ē(žĚīŪēė Žč§žį®žõźŽ≤ē)Í≥ľ ÍįôžĚÄ Í≤Ĺž†úžĄĪ ŪŹČÍįÄŽ™®ŪėēžĚĄ žā¨žö©Ūēėžó¨ Ž∂ĄžĄĚžĚĄ žąėŪĖČŪēėÍ≥† žěąŽč§. ÍįĄŪ鳎≤ēžĚė Í≤Ĺžöį 2002ŽÖĄ žĚīž†ĄÍĻĆžßÄ ž£ľŽ°ú žā¨žö©Žźú Ž™®ŪėēžúľŽ°úžĄú ŽÜćžěĎŽ¨ľŪĒľŪēīžē°žĚĄ Íłįž§ÄžúľŽ°ú ŪĒľŪēīÍ≥ĄžąėŽ•ľ ž†Āžö©ŪēėŽĮÄŽ°ú žėąžÉĀŪĒľŪēīžē° žāįž†ēžĚī ÍįĄŪéłŪēėŽč§ŽäĒ žě•ž†źžĚī žěąŽč§. Žč§ŽßĆ, žā¨žóÖžĚė Í≤Ĺž†úžĄĪžĚī ŽĻĄÍĶźž†Ā ŽāģÍ≤Ć ŪŹČÍįÄŽźėÍ≥† Ūēėž≤úžĚīŽāė žąėÍ≥Ąž†Ąž≤īžĚė žě֞앞̥ Í≥†Ž†§ŪēėžßÄ Ž™ĽŪēúŽč§ŽäĒ Žč®ž†źžĚī žěąŽč§(MOIS, 2017). ÍįúžĄ†Ž≤ēžĚÄ ÍįĄŪ鳎≤ēžóź žĻ®žąėŽ©īž†Ā‚čÖŪĒľŪēīžē° ŪöĆÍ∑Äžč̞̥ ž∂ĒÍįÄŪēú ŪéłžĚĶžāįž†ē Ž™®ŪėēžúľŽ°ú Ž∂ĄžĄĚŽ≤ĒžúĄÍįÄ ÍįĄŪ鳎≤ēžóź ŽĻĄŪēī ŪŹ≠ŽĄďŽč§ŽäĒ žě•ž†źžĚĄ ÍįÄžßÄÍ≥† žěąŽč§. ŪēėžßÄŽßĆ, žėąžÉĀŪĒľŪēīžē° žāįž†ēžóź ÍįĄž†ĎŪéłžĚĶžĚī Í≥†Ž†§ŽźėžßÄ žēäžúľŽ©į, žĻ®žąėŪĒľŪēī ÍįēŽŹĄžóź žėĀŪĖ•žĚĄ ž£ľŽäĒ žĻ®žąėžč¨Í≥ľ žĻ®žąėÍłįÍįĄŽŹĄ ŽįėžėĀŪēėžßÄ žēäžēėŽč§(MOIS, 2017). Žč§žį®žõźŽ≤ēžĚÄ 2004ŽÖĄžóź ÍįúŽįúŽźú Í≤Ĺž†úžĄĪ ŪŹČÍįÄŽ™®ŪėēžúľŽ°úžĄú(MOCT, 2004), ŪôćžąėŽĻąŽŹĄÍįúŽÖźžĚī ž†Āžö©ŽźėžĖī žĻ®žąėŽ©īž†Ā žāįž†ē Í≤įÍ≥ľžĚė žč†ŽĘįžĄĪžĚī ŽÜíÍ≥† žėąžÉĀŪĒľŪēīžē° žāįž†ē Í≤įÍ≥ľÍįÄ ÍįúžĄ†Ž≤ēžóź ŽĻĄŪēī ž†ēŪôēŪēėŽč§Í≥† ŪŹČÍįÄŽźėÍ≥† žěąŽč§. Žč§ŽßĆ žĚ掩īŽŹôŽ≥ĄŽ°ú Ūē©žāįŽźú žěźŽ£ĆŽ•ľ žā¨žö©ŪēėÍłį ŽēĆŽ¨łžóź ÍįúŽ≥Ą ÍĪīŽ¨ľžóź ŽĆÄŪēú ŪĒľŪēī žāįž†ēžóźŽäĒ ŪēúÍ≥ĄŽ•ľ ÍįÄžßÄÍ≥† žěąŽč§(Lee et al., 2006; MOIS, 2017).
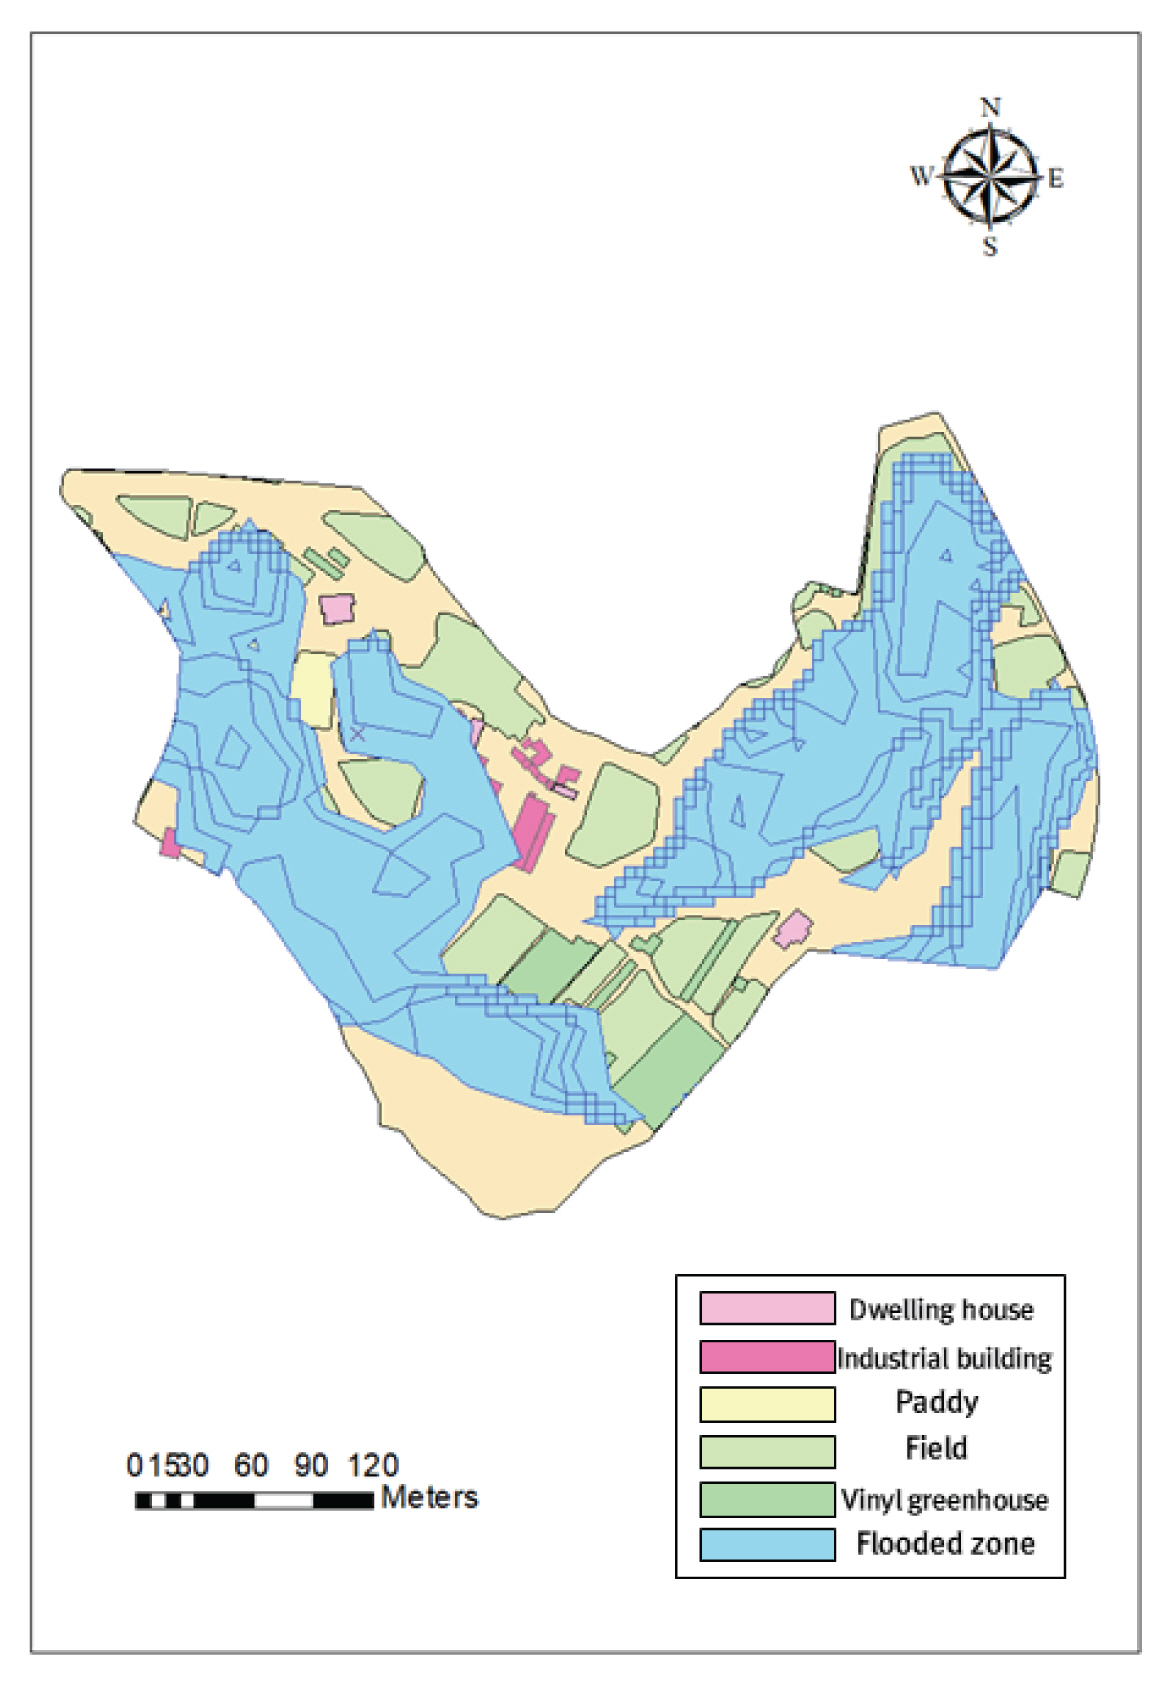
Ž≥ł žóįÍĶ¨žóźžĄúŽäĒ 2014ŽÖĄ ŽŹôŽĎźž≤úžčú ŪíćžąėŪēīž†ÄÍįźžĘÖŪē©Í≥ĄŪöć Ž≥īÍ≥†žĄúžóźžĄú žĖłÍłČŽźú 5Íįú Ūēėž≤úžě¨ŪēīžúĄŪóėžßÄÍĶ¨(ÍīĎžēĒž†ú2žßÄÍĶ¨, Ž™ĽÍ≥®ž≤úžßÄÍĶ¨, žēąŽßźž≤úžßÄÍĶ¨, ŽŹôŽßČž≤úžßÄÍĶ¨, ŽīČŽŹôž≤úžßÄÍĶ¨)Ž•ľ ŽĆÄžÉĀžúľŽ°ú ÍįúžĄ†Žźú Í≤Ĺž†úžĄĪ ŪŹČÍįÄŽ™®ŪėēžĚĄ ž†Āžö©ŪēīŽ≥īÍ≥†žěź ŪēėžėÄŽč§. ŽŹôŽĎźž≤úžčúžóź žúĄžĻėŪēú Ūēėž≤úžě¨ŪēīžúĄŪóėžßÄÍĶ¨Ž•ľ žóįÍĶ¨ŽĆÄžÉĀ žßÄžó≠žúľŽ°ú žĄ†ž†ēŪēú žĚīžú†ŽäĒ Žč§žĚĆÍ≥ľ ÍįôŽč§. žöįžĄ†, žč†ž≤ú, žÉĀŪĆ®ž≤ú, ŽŹôŽĎźž≤úÍ≥ľ ÍįôžĚÄ 3ÍįúžĚė žßÄŽį©Ūēėž≤úžĚī žó¨Žü¨ žÜĆŪēėž≤úÍ≥ľ Ūē®ÍĽė Í≥†Ž£® Ž∂ĄŪŹ¨Ūēī žěąÍ≥†, ÍĪīŽ¨ľ, ŽÜćÍ≤ĹžßÄ ŽďĪ žěźžāįžĚī Ž∂ĄŪŹ¨Žźú žú†ŪėēŽ≥ĄŽ°ú žßÄÍĶ¨Ž•ľ žĄ†Ž≥ĄŪēėÍłį žö©žĚīŪēėÍłį ŽēĆŽ¨łžĚīŽč§. ŽėźŪēú, Í≥ľÍĪį Žč§Ž•ł Í≤Ĺž†úžĄĪŪŹČÍįÄ Ž™®ŽćłŽ°ú žčúŽ≤Ēž†Āžö©ŪēīŽ≥īŽ©īžĄú Ž∂ĄžĄĚžóź ŪēĄžöĒŪēú ž∂©Ž∂ĄŪēú žěźŽ£ĆŽ•ľ ŪôēŽ≥īŪĖąÍłį ŽēĆŽ¨łžĚīŽč§. Ž≥ł žóįÍĶ¨žóźžĄú žßĀž†ĎŪéłžĚĶ žāįž†ēžĚÄ ŪėĄžě¨ ŪĖČž†ēžēąž†ĄŽ∂Ä R&D Í≥ľž†úžóźžĄú ÍįúŽįúŪēú žĚľŽįėžěźžāįÍ≥ľ Í≥ĶÍ≥Ķžěźžāįžóź ŽĆÄŪēú ‚ÄėŪēúÍĶ≠Ūėē žÜźžÉĀ‚č֞ܟžč§Ūē®žąė‚ÄôŽ•ľ žĚīžö©ŪēėžėÄŽč§. ÍįĄž†ĎŪéłžĚĶžĚė Í≤Ĺžöį ŽĻĄžö©ÍįÄžĻėŽ°ú žāįž†ēŪē† žąė žěąŽäĒ 5ÍįúžĚė Ūē≠Ž™©(žĚĎͳȂčÖžě•ÍłįÍĶ¨Ūėł ŽĻĄžö©, žÉĚÍ≥ĄžßÄžõź ŽĻĄžö©, ŪēôžěźÍłą Ž©īž†ú žßÄžõź ŽĻĄžö©, žėĀžóÖž†ēžßÄ‚čÖž†ēž≤ī ŪĒľŪēīžē°, žĚĎͳȎĆÄžĪÖŽĻĄžö©)žĚĄ žĄ†ž†ē ŽįŹ ÍįúŽįúŪēėžó¨ žßÄÍĶ¨Žč®žúĄžĚė žÜĆÍ∑úŽ™® žßÄžó≠žóź ž†Āžö©Ūē† žąė žěąŽŹĄŽ°Ě ŪēėžėÄŽč§.
Fig. 1žĚÄ Ž≥ł žóįÍĶ¨žĚė ŪĚźŽ¶ĄŽŹĄŽ•ľ ŽāėŪÉÄŽāł Í≤ÉžĚīŽč§. ŽŹĄŽ°úŽ™Öž£ľžÜĆ ž†ĄžěźžßÄŽŹĄ, ŽÜćÍ≤ĹžßÄ ž†ĄžěźžßÄŽŹĄ, žĄľžĄúžä§ ÍłįŽįė ŪÜĶÍ≥ĄžěźŽ£Ć ŽďĪžĚĄ žā¨žö©Ūēī Í≥ĶÍįĄŽ∂ĄžĄĚžĚĄ žßĄŪĖČŪēėžėÄžúľŽ©į, ŪĖČž†ēžēąž†ĄŽ∂Ä R&D Í≥ľž†úŽ•ľ ŪÜĶŪēī ŽßƎ吏ĖīžßĄ ž†ĄÍĶ≠ Žč®žúĄ 100ŽÖĄ ŽĻąŽŹĄžĚė žßÄŽį©Ūēėž≤ú, žÜĆŪēėž≤ú žĻ®žąėžėąžÉĀŽŹĄŽ•ľ žā¨žö©Ūēī ŪĒľŪēīžē°žĚĄ žāįž†ēŪēėžėÄŽč§. žĶúžĘÖž†ĀžúľŽ°ú žßĀž†ĎŪéłžĚĶÍ≥ľ ÍįĄž†ĎŪéłžĚĶ Ūē≠Ž™©žĚĄ ŽįėžėĀŪēú žßÄÍĶ¨Žč®žúĄ B/CÍįížĚĄ ŽŹĄž∂úŪēėžó¨ žě¨ŪēīžėąŽį©žā¨žóÖžóź ŽĆÄŪēú Í≤Ĺž†úžĄĪžĚĄ ŪŹČÍįÄŪēėžėÄŽč§.
2. žě¨ŪēīžėąŽį©žā¨žó̥֞ žúĄŪēú Í≤Ĺž†úžĄĪ ŪŹČÍįÄŽ™®Ūėē
2.1 žßĀž†ĎŪéłžĚĶžóź ŽĆÄŪēú ÍĶ≠Žāī Í≤Ĺž†úžĄĪ ŪŹČÍįÄŽ™®Ūėē
2.1.1 Íłįž°ī Í≤Ĺž†úžĄĪ ŪŹČÍįÄŽ™®Ūėē
žě¨ŪēīžėąŽį©žā¨žóÖžĚė Ūą¨žěźžöįžĄ†žąúžúĄ Í≤įž†ēžóź žā¨žö©Žźú Íłįž°ī Í≤Ĺž†úžĄĪ ŪŹČÍįÄŽ™®ŪėēžĚĄ ŽĻĄÍĶźŪēėŽ©ī Table 1Í≥ľ ÍįôŽč§.
žĄł ÍįÄžßÄ ŪŹČÍįÄŽį©Ž≤ē ž§Ď ÍįúžĄ†Ž≤ē ŽįŹ Žč§žį®žõźŽ≤ēžĚÄ ŪėĄžě¨ÍĻĆžßÄ žě¨ŪēīžėąŽį©žā¨žó̥֞ ŪŹ¨Ūē®Ūēú žĻėžąėžā¨žóÖžĚė Í≤Ĺž†úžĄĪŽ∂ĄžĄĚžóźžĄú Íĺłž§ÄŪěą žā¨žö©ŽźėÍ≥† žěąžßÄŽßĆ, ÍįÄžě• žĶúÍ∑ľ Ž™®ŪėēžĚł Žč§žį®žõźŽ≤ēžĚī 2004ŽÖĄ ÍĶ≠Ū܆ÍĶźŪÜĶŽ∂Ğ󟞥ú ÍįúŽįúŽźú žĚīŽěėŽ°ú Ž™®ŪėēžĚė žóÖŽćįžĚīŪäłÍįÄ žßÄžÜ枆ĀžúľŽ°ú žĚīŽ£®žĖīžßÄÍ≥† žěąžßÄ žēäŽč§. žĚīžóź ŽĒįŽĚľ ŪėĄ žčúž†źžóźžĄú žěźžóįžě¨ŽāúžĚī ŽįúžÉĚŪĖąžĚĄ ŽēĆ ÍįĀÍįĀžĚė ŪĒľŪēīŪē≠Ž™©Ž≥ĄŽ°ú žėąžÉĀ ŪĒľŪēīžē°žĚĄ ž†úŽĆÄŽ°ú žāįž†ēŪēīŽāīžßÄ Ž™ĽŪēėÍ≥† žěąŽč§. Žč§žį®žõźŽ≤ēžóźžĄú ŽŹĄž∂úŽźú Ž¨łž†úž†źžĚÄ Žč§žĚĆÍ≥ľ ÍįôŽč§.
ž≤ęžßł, žĶúžč† žõźŽč®žúĄ Žč®ÍįÄžĚė ŽĮłŽįėžėĀžĚīŽč§. 2004ŽÖĄ Žč§žį®žõźŽ≤ēžĚī ÍįúŽįúŽźú žĚīŽěėŽ°ú Žį©Ž≤ēŽ°†Í≥ľ Ūē®ÍĽė ž†úžčúŽźú ŽÜćÍ≤ĹžßÄ Žß§Ž™į ŽįŹ žú†žč§ Ž©īž†Ā Žč®ÍįÄ, žĚłŽ™ÖŪĒľŪēī žÜźžč§žõźŽč®žúĄ ŽďĪžĚÄ Ž¨ľÍįÄžßÄžąėŽ•ľ žā¨žö©Ūēī Íłįž§ÄžóįŽŹĄžóź Žßěž∂ĒžĖī žā¨žö©ŪĖąžúľŽ©į, žĶúžč†žĚė žõźŽč®žúĄ Žč®ÍįÄŽ•ľ žā¨žö©ŪēīŽŹĄ ŪēīŽčĻ žóįÍĶ¨žóźžĄúŽßĆ ŽįėžėĀŽźú žěĄžčúž°įžĻėžėÄŽč§.
ŽĎėžßł, Í≥ľÍĪį ž†ÄŪēīžÉĀŽŹĄžĚė žĚłŽ≤§Ū܆Ž¶¨ žěźŽ£ĆŽ•ľ žā¨žö©Ūēú Í≥ĶÍįĄŽ∂ĄžĄĚžĚīŽč§. Žč§žį®žõźŽ≤ēžóźžĄúŽäĒ žĚľŽįėž†ĀžúľŽ°ú Ū܆žßÄŪĒľŽ≥ĶŽŹĄŽ•ľ žā¨žö©Ūēī ÍĪīŽ¨ľŪĒľŪēīžē°Í≥ľ ŽÜćÍ≤ĹžßÄ-ŽÜćžěĎŽ¨ľ ŪĒľŪēīžē°žĚĄ žāįž†ēŪēėŽäĒŽćį, žĶúÍ∑ľžóź ŽßƎ吏ĖīžßĄ Í≥ĶÍįĄ žĚłŽ≤§Ū܆Ž¶¨ žěźŽ£ĆžĚł ŽŹĄŽ°úŽ™Ö ž†ĄžěźžßÄŽŹĄžôÄ ŪĆúŽßĶ ÍłįŽįėžĚė ŽÜćÍ≤ĹžßÄ ž†ĄžěźžßÄŽŹĄžôÄ ŽĻĄÍĶźŪĖąžĚĄ ŽēĆ žö©ŽŹĄŽ≥Ą ÍĪīŽ¨ľ, ŽÜćÍ≤ĹžßÄ ÍįĚž≤ī Ž∂ĄŽ•ėžĚė ž†ēŪôēžĄĪ, ÍįĚž≤īŽ≥Ą žúĄžĻė ŽįŹ Ž©īž†ĀžĚė ž†ēŽįÄŽŹĄ ŽďĪžóźžĄú ŪĀį žį®žĚīŽ•ľ Ž≥īžĚłŽč§.
ŽėźŪēú, Žč§žį®žõźŽ≤ēžĚÄ ÍįúŽįú žčúž†źžóźžĄú žā¨žö© ÍįÄŽä•ŪĖąžóąŽćė žĚłŽ≤§Ū܆Ž¶¨ žěźŽ£ĆŽ•ľ ÍłįŽįėžúľŽ°ú ŽßƎ吏Ėīž°ĆÍłį ŽēĆŽ¨łžóź žĻ®žąėžį®ŽüČ ŪĒľŪēīžē° ŽďĪžĚė žßĀž†ĎŪéłžĚĶŽŅźŽßĆ žēĄŽčąŽĚľ ÍįĄž†ĎŪéłžĚĶŽŹĄ ŽįėžėĀŽźėžßÄ Ž™ĽŪĖąŽč§.
žĚīŽü¨Ūēú Ž¨łž†úž†ź ŽēĆŽ¨łžóź ŪĖČž†ēžēąž†ĄŽ∂Ğ󟞥úŽäĒ R&D Í≥ľž†úžóźžĄú ÍįúŽįúŪēú ‚ÄėŪēúÍĶ≠Ūėē žÜźžÉĀ‚č֞ܟžč§Ūē®žąė‚ÄôŽ•ľ ŪôćžąėŪĒľŪēīžóź ŽĒįŽ•ł Í≤Ĺž†úžĄĪ Ž∂ĄžĄĚžóź žÉąŽ°≠Í≤Ć ŽŹĄžěÖŪēėžėÄŽč§.
2.1.2 ŪēúÍĶ≠Ūėē žÜźžÉĀ‚č֞ܟžč§Ūē®žąė
žēěžóźžĄú ž†úžčúŪēú Ž¨łž†úž†źžĚĄ ŪēīÍ≤įŪēėÍłį žúĄŪēī ŪēúÍĶ≠Ūėē žÜźžÉĀ‚č֞ܟžč§Ūē®žąėžóźžĄúŽäĒ žĻ®žąėŪĒľŪēīžóź ŽÖłž∂úŽź† žßÄžó≠žĚĄ ž†ēŪôēŪěą ŪĆĆžēÖŪēėÍ≥†žěź Í≥†ŪēīžÉĀŽŹĄžĚė žěźŽ£ĆŽ•ľ žā¨žö©ŪēėžėÄŽč§. žõźŽč®žúĄ Žč®ÍįÄŽäĒ ŪēúÍĶ≠Ūėē žÜźžÉĀ‚č֞ܟžč§Ūē®žąėŽ•ľ ž†Āžö©Ūēú Ūē≠Ž™©žóź ŽĆÄŪēī ž†Āž†ąžĄĪžĚĄ Í≤ÄŪ܆Ūēėžó¨ ž†úžčúŪēėžėÄÍ≥†, ŪĒľŪēī Ūē≠Ž™©Ž≥ĄŽ°ú Í≥ĄŽüČŪôĒÍįÄ ÍįÄŽä•Ūēú Žį©Ž≤ēžĚĄ žöįžĄ†ž†ĀžúľŽ°ú žĄ†Ž≥ĄŪēėžėÄŽč§.
Íłįž°īžĚė Žč§žį®žõźŽ≤ēÍ≥ľ ŽĻĄÍĶźŪĖąžĚĄ ŽēĆ ÍįúžĄ†Žźú žā¨Ūē≠žĚĄ žāīŪéīŽ≥īŽ©ī Table 2žôÄ ÍįôžúľŽ©į, ž£ľÍĪįÍĪīŽ¨ľžěźžāį, žāįžóÖžěźžāį(ŽĻĄž£ľÍĪįÍĪīŽ¨ľ), žį®ŽüČ, ŽÜćžóÖžěźžāį, žĚłŽ™Ö ŽįŹ žĚīžě¨ŽĮľ, Í≥ĶÍ≥ĶžčúžĄ§Ž¨ľ Ūē≠Ž™©žóź ŽĆÄŪēėžó¨ ÍįúžĄ†Žźú Í≤įÍ≥ľÍįÄ ŽŹĄž∂úŽźėžóąŽč§(Kim et al., 2018).
Ž≥ł žóįÍĶ¨žóźžĄúŽäĒ Í≤Ĺž†úžĄĪ ŪŹČÍįÄŽ™®ŪėēžĚė žĶúžč†ŪĆźžĚł ŪēúÍĶ≠Ūėē žÜźžÉĀ‚č֞ܟžč§Ūē®žąėŽ•ľ žā¨žö©Ūēėžó¨ žě¨ŪēīžėąŽį©žā¨žóÖžĚī žčúŪĖČŽźėŽäĒ Ūēėž≤úžě¨ŪēīžúĄŪóėžßÄÍĶ¨Ž•ľ ŽĆÄžÉĀžúľŽ°ú žßĀž†ĎŪéłžĚĶžĚĄ žāįž†ēŪēėžėÄŽč§.
2.2 ÍįĄž†ĎŪéłžĚĶžĚĄ Í≥†Ž†§Ūēú Í≤Ĺž†úžĄĪ ŪŹČÍįÄŽ™®Ūėē ž†úžčú
Ž≥ł žóįÍĶ¨žóźžĄúŽäĒ Ūėłžöį, ŪÉúŪíćžúľŽ°ú ŽįúžÉĚŪēėŽäĒ žĻ®žąėŪĒľŪēī ž§Ď ŪēúÍĶ≠Ūėē žÜźžÉĀ‚č֞ܟžč§Ūē®žąėŽ°ú žāįž†ēŽźėŽäĒ žßĀž†ĎŪéłžĚĶ žôłžóźŽŹĄ 5ÍįÄžßÄ ÍįĄž†ĎŪéłžĚĶ(žĚĎͳȂčÖžě•ÍłįÍĶ¨Ūėł ŽĻĄžö©, žÉĚÍ≥ĄžßÄžõź ŽĻĄžö©, ŪēôžěźÍłą Ž©īž†ú žßÄžõź ŽĻĄžö©, žėĀžóÖž†ēžßÄ‚čÖž†ēž≤ī ŪĒľŪēīžē°, žĚĎͳȎĆÄžĪÖŽĻĄžö©)žĚĄ ŽįėžėĀŪēėžó¨ Í≤Ĺž†úžĄĪ ŪŹČÍįÄ Ž™®ŪėēžĚĄ ž†úžčúŪēėžėÄŽč§.
FEMA (2012)žĚė Hazus-MHžôÄ ÍįôžĚī žĚľŽįėž†ĀžúľŽ°ú ÍįĄž†ĎŪéłžĚĶžĚĄ Žč§Ž£®ŽäĒ Í≤Ĺž†úžĄĪ ŪŹČÍįÄŽ™®ŪėēžĚÄ žāįžóÖžóįÍīÄŽ∂ĄžĄĚžĚĄ žĚīžö©Ūēī Í≤Ĺž†úž†Ā ŪĆĆÍłČŪö®Í≥ľŽ•ľ ÍįĄž†ĎŪéłžĚĶžúľŽ°ú Ž∂ĄŽ•ėŪēėžó¨ žāįž†ēŪēúŽč§. Ž≥ł žóįÍĶ¨žóźžĄúŽäĒ ž†Āžö© ÍįÄŽä•Ūēú ÍįĄž†ĎŪéłžĚĶ Ūē≠Ž™©žĚĄ žĄ†ž†ē ŽįŹ ÍįúŽįúŪēėžó¨ Í≤Ĺž†úžĄĪ ŪŹČÍįÄŽ™®Ūėēžóź ž†Āžö©ŪēėžėÄŽč§. Žč§žĚĆžĚÄ ÍįĀÍįĀžĚė ÍįĄž†ĎŪéłžĚĶ Ūē≠Ž™©Ž≥ĄŽ°ú ž†Āžö©Žźú Žį©Ž≤ēŽ°†žĚĄ ŽāėŪÉÄŽāł Í≤ÉžĚīŽč§.
2.2.1 žĚĎͳȂčÖžě•ÍłįÍĶ¨Ūėł ŽĻĄžö©
žĚĎͳȂčÖžě•ÍłįÍĶ¨ŪėłŽĻĄžö©žĚÄ žěźžóįžě¨Žāú Ž≥ĶÍĶ¨ŽĻĄžö© žāįž†ēÍłįž§Ä Íįúž†ē Í≥†žčúžēąžóź ŽāėžôÄ žěąŽäĒ žě•Íłį ÍĶ¨ŪėłŽĻĄŽ•ľ Žč®ÍįÄŽ°ú žĄ§ž†ēŪēėžó¨ žāįž†ēŪēėžėÄŽč§. 2014ŽÖĄ Íłįž§Ä žě•Íłį ÍĶ¨ŪėłŽĻĄžĚė 1žĚł 1žĚľ Žč®ÍįÄŽäĒ 7,000žõźžĚłŽćį ŪēīŽčĻ Žč®ÍįÄŽäĒ žěźžóįžě¨Žāú Ž≥ĶÍĶ¨ŽĻĄžö© žāįž†ēÍłįž§Äžóź ŽĆÄŪēī Íįúž†ē Í≥†žčúžēąžĚī Žāėžė¨ ŽēĆŽßąŽč§ Ž≥ÄÍ≤ĹŽźėžóąŽč§. Table 3žĚÄ Í≥ľÍĪį žĚĎͳȂčÖžě•ÍłįÍĶ¨ŪėłŽĻĄžö© Žč®ÍįÄžôÄ žāįž†ēžčĚ(Eq. (1))žĚĄ ŽāėŪÉÄŽāł Í≤ÉžĚīŽč§.
(1)
žĚīžě¨ŽĮľžąėŽäĒ žĚīžě¨ŽĮľ ŪĒľŪēīžē°žĚĄ žāįž†ēŪēėŽ©īžĄú ŽŹĄž∂úŽźú žĚīžě¨ŽĮľžąėŽ•ľ ž†Āžö©ŪēėŽ©ī ŽźėŽ©į, ŪŹČÍ∑†ŽĆÄŪĒľžĚľžąėŽäĒ ‚ÄėžąėžěźžõźŽ∂ÄŽ¨łžā¨žóÖžĚė žėąŽĻĄŪÉÄŽčĻžĄĪž°įžā¨ ŪĎúž§ÄžßÄžĻ® žąėž†ē‚čÖŽ≥īžôĄ žóįÍĶ¨ (ž†ú4ŪĆź)‚ÄôžóźžĄú Í≥ľÍĪį 10ŽÖĄÍįĄžĚė žě¨ŪēīžóįŽ≥īŽ•ľ žįłÍ≥†Ūēėžó¨ ž†úžčúŪēú 10žĚľžĚĄ ž†Āžö©ŪēėžėÄŽč§.
2.2.2 žÉĚÍ≥ĄžßÄžõź ŽĻĄžö©
2018ŽÖĄ žěźžóįžě¨Žāú Ž≥ĶÍĶ¨ŽĻĄžö© žāįž†ēÍłįž§Ä Íįúž†ē Í≥†žčúžēąžóźžĄúŽäĒ ÍįÄÍĶ¨žĚė ÍĶ¨žĄĪžõź žąėžóź ŽĒįŽĚľ žÉĚÍ≥ĄžßÄžõźŽĻĄŽ•ľ žį®ŽďĪŪēėžó¨ žßÄÍłČŪēėÍ≥† žěąŽč§. ŪēėžßÄŽßĆ žěźžóįžě¨ŪēīžúĄŪóėžßÄÍĶ¨Ž≥ĄŽ°ú ŪĒľŪēīÍįÄ ŽįúžÉĚŪēú ÍįÄÍĶ¨ Žāī ÍĶ¨žĄĪžõźžĚė žąėŽ•ľ ž†ēŪôēŪěą ŪĆĆžēÖŪēėŽäĒ Í≤ÉžĚÄ žĖīŽ†ĶŽč§.
Í∑łŽü¨ŽĮÄŽ°ú, Ž≥ł žóįÍĶ¨žóźžĄúŽäĒ žÉĚÍ≥ĄžßÄžõźŽĻĄ žßÄÍłČ Žč®ÍįÄŽ•ľ Í≥ľÍĪį žěźžóįžě¨Žāú Ž≥ĶÍĶ¨ŽĻĄžö© žāįž†ēÍłįž§ÄžóźžĄú žā¨žö©ŽźėžóąŽćė ŽčĻŪēīžóįŽŹĄ ž†ēŽ∂Ä žĖĎÍ≥° Žį©ž∂úÍįÄÍ≤©žúľŽ°ú žĄ§ž†ēŪēėžėÄŽč§. žėąŽ•ľ Žď§žĖī 2014ŽÖĄ Íłįž§Ä 80kgžóź ŪēīŽčĻŪēėŽäĒ ž†ēŽ∂Ä žĖĎÍ≥° 5ÍįÄŽßąžĚė Žį©ž∂ú ÍįÄÍ≤©žĚÄ 910,000žõźžĚīŽ©į, Ž≥ł žóįÍĶ¨žóźžĄúŽäĒ žĻ®žąėŪĒľŪēīŽ•ľ žěÖžĚÄ ÍįÄÍĶ¨ Ž™®ŽĎźÍįÄ žÉĚÍ≥ĄžßÄžõźŽĻĄŽ•ľ ŽįõŽäĒŽč§Í≥† ÍįÄž†ēŪēėžėÄŽč§. žĚľŽįėž†ĀžúľŽ°ú žĻ®žąėŪĒľŪēīŽ•ľ žěÖŽäĒ ÍįÄÍĶ¨ŽäĒ ž£ľÍĪįÍĪīŽ¨ľ 1žłĶžóź ÍĪįž£ľŪēėŽäĒ ÍįÄÍĶ¨žóź ŪēīŽčĻŪēėŽĮÄŽ°ú žÉĚÍ≥ĄžßÄžõź ŽĻĄžö©Í≥ľ ÍīÄŽ†®Žźú žāįž†ēžčĚžĚÄ Eq. (2)žôÄ ÍįôŽč§.
2.2.3 ŪēôžěźÍłą Ž©īž†ú žßÄžõź ŽĻĄžö©
ŪēôžěźÍłą Ž©īž†ú žßÄžõź ŽĻĄžö©žĚÄ žěźžóįžě¨Žāú Ž≥ĶÍĶ¨ŽĻĄžö© žāįž†ēÍłįž§Ä Íįúž†ē Í≥†žčúžēąžĚĄ Í∑ľÍĪįŽ°ú Ūēėžó¨ ŪĒľŪēīŽ•ľ žěÖžĚÄ Í≥†ŽďĪŪēôžÉ̞̥ ŽĆÄžÉĀžúľŽ°ú 6ÍįúžõĒŽ∂ĄžĚė ŪēôžěźÍłąžĚĄ 100% žßÄžõźŪēėŽäĒ Í≤ɞ̥ ŽßźŪēúŽč§.
Ž≥ł žóįÍĶ¨žóźžĄúŽäĒ ŽĆÄžÉĀžßÄžó≠žóź ÍĪįž£ľŪēėŽäĒ žĄĪžóįŽ†ĻŽ≥Ą žĚłÍĶ¨žąė ž§Ď Í≥†ŽďĪŪēôžÉĚžóź ŪēīŽčĻŪēėŽäĒ 17~19žĄłžĚė žóįŽ†ĻŽĆĞ󟞥ú žĚīžě¨ŽĮľžĚī ŽįúžÉĚŪĖąžĚĄ Í≤Ĺžöį 2017ŽÖĄŽŹĄ žĚīž†ĄžóźŽäĒ ŽĻĄž†ĄŽ¨łÍ≥Ą Í≥†ŽďĪŪēôÍĶź Žč®ÍįÄŽ•ľ žā¨žö©ŪēėŽ©į, 2017ŽÖĄŽŹĄŽ∂ÄŪĄįŽäĒ žĚľŽįėÍ≥†(Í≥ĶŽ¶Ĺ, žā¨Ž¶Ĺ Žč®ÍįÄ ŽŹôžĚľ) Íłįž§ÄžĚė Žč®ÍįÄŽ•ľ žā¨žö©Ūēėžó¨ ŪĒľŪēīžē°žĚĄ žāįž†ēŪēėžėÄŽč§. žĚīžě¨ŽĮľžĚī Žźú Í≥†ŽďĪŪēôžÉ̎吏ĚÄ Ž™®ŽĎź ŪēôžěźÍłą žßÄÍłČ ŽĆÄžÉĀžúľŽ°ú Ž∂ĄŽ•ėŽźúŽč§Í≥† ÍįÄž†ēŪēėŽ©į, Table 4žôÄ Eq. (3)žĚÄ 2018ŽÖĄ Íłįž§Ä Í≤ĹÍłįŽŹĄ Í≥†ŽďĪŪēôÍĶźŽ≥Ą žßÄžõź ŪēôžěźÍłąÍ≥ľ žāįž†ēžč̞̥ ŽāėŪÉÄŽāł Í≤ÉžĚīŽč§.
2.2.4 žėĀžóÖž†ēžßÄ‚čÖž†ēž≤ī ŪĒľŪēīžē°
žėĀžóÖž†ēžßÄ‚čÖž†ēž≤īŽ°ú žĚłŪēú ŪĒľŪēīžē°žĚÄ ŽĆÄžÉĀ žßÄžó≠žóźžĄú žĻ®žąėŪĒľŪēīŽ•ľ žěÖžĚÄ žā¨žóÖžě•(ŽĻĄž£ľÍĪįÍĪīŽ¨ľ)žĚĄ ŽĆÄžÉĀžúľŽ°ú žāįž†ēŪēú žėĀžóÖž†ēžßÄ‚čÖž†ēž≤īžĚľžąėžóź ŽĒįŽ•ł ŪĒľŪēīžē°žĚĄ ŽßźŪēúŽč§. žÜźžč§ žõźŽč®žúĄŽäĒ Íłįž§ÄžóįŽŹĄ žāįžóÖžú†ŪėēŽ≥Ą žĘÖžā¨žěźžąė 1Ž™ÖŽčĻ Ž∂ÄÍįÄÍįÄžĻėžē°žĚĄ žā¨žö©ŪēúŽč§. ž¶Č ŽĆÄžÉĀ žßÄÍĶ¨ ŽāīžóźžĄú Í∑ľŽ¨īŪēėŽäĒ žāįžóÖžú†ŪėēŽ≥Ą žīĚ žĘÖžā¨žěźžąėžóź ŽĆÄŪēėžó¨ žĻ®žąėŽźú žā¨žóÖžě•žąėžóź ŽĻĄŽ°ÄŪēī žėĀžóÖž†ēžßÄ‚čÖž†ēž≤ī ŪĒľŪēīžē°žĚĄ žāįž†ēŪēėŽäĒ Í≤ÉžĚīŽč§. ÍīÄŽ†® žāįž†ēžčĚžĚÄ Eq. (4)žôÄ ÍįôŽč§.
(4)
Table 5ŽäĒ žĻ®žąėžč¨Ž≥Ą žėĀžóÖž†ēžßĬ∑ž†ēž≤īžĚľžąėŽ•ľ ŽāėŪÉÄŽāł Í≤ÉžúľŽ°úžĄú žĚľŽ≥ł ÍĶ≠Ū܆ÍĶźŪÜĶžĄĪžóźžĄú ŽįúÍįĄŪēú žĻėžąėÍ≤Ĺž†úž°įžā¨Žß§ŽČīžĖľ (2005)žĚĄ žįłÍ≥†ŪēėžėÄŽč§.
ŽėźŪēú, 2014ŽÖĄ Íłįž§Ä žāįžóÖžú†ŪėēŽ≥Ą žĘÖžā¨žěźžąėŽäĒ ŪēúÍĶ≠ŪĎúž§ÄžāįžóÖŽ∂ĄŽ•ė(9žį®)Ž•ľ Íłįž§ÄžúľŽ°ú ŪÜĶÍ≥ĄžěźŽ£ĆÍįÄ ž†úÍ≥ĶŽźėÍłį ŽēĆŽ¨łžóź KOSISžóźžĄú ž†úÍ≥ĶŪēėŽäĒ žāįžóÖžú†ŪėēŽ≥Ą Ž∂ÄÍįÄÍįÄžĻėžóź ŽĆÄŪēī ŽŹôžĚľŪēú žāįžóÖŽĀľŽ¶¨ Žß§žĻ≠ŪēėÍłį žúĄŪēīžĄ† Table 6Í≥ľ ÍįôžĚī ž†Āžö©Ūēīž£ľŽ©ī ŽźúŽč§.
2.2.5 žĚĎͳȎĆÄžĪÖŽĻĄžö©(ÍįÄž†ē ŽįŹ žā¨žóÖžě•)
žĚĎͳȎĆÄžĪÖŽĻĄžö©žĚÄ žĚľŽ≥ł ÍĶ≠Ū܆ÍĶźŪÜĶžĄĪžóźžĄú ŽįúÍįĄŪēú žĻėžąėÍ≤Ĺž†úž°įžā¨Žß§ŽČīžĖľ(2005)žĚĄ žįłÍ≥†Ūēėžó¨ žāįž†ēŪēėžėÄŽč§(MLIT, 2005). ÍįÄž†ēžóźžĄúžĚė žĚĎͳȎĆÄžĪÖŽĻĄžö©žĚÄ ž£ľÍĪįÍĪīŽ¨ľžĚė žĻ®žąėžóź ŽĒįŽ•ł ž≤≠žÜĆŽÖłŽŹôžĚė ŽĆÄÍįÄžôÄ ŽĆÄž≤īŪôúŽŹôžóź ŽĒįŽ•ł ž∂ĒÍįÄŽĻĄžö©žĚė Ūē©žĚĄ žāįž†ēŪēú Í≤ÉžĚīŽč§. žā¨žóÖžě•žĚÄ ÍįÄž†ēÍ≥ľŽäĒ Žč¨Ž¶¨ žā¨žóÖžě•Ž≥Ą ŽĆÄž≤īŪôúŽŹôžóź ŽĒįŽ•ł ž∂ĒÍįÄŽĻĄžö©Žßƞ̥ žāįž†ēŪēėÍ≥† ž≤≠žÜĆŽÖłŽŹôžĚė ŽĆÄÍįÄŽäĒ žāįž†ēŪēėžßÄ žēäžēėŽäĒŽćį, Í∑ł žĚīžú†ŽäĒ ž≤≠žÜĆŽÖłŽŹôžěźŽ°úŽ∂ÄŪĄį ŽįúžÉĚŪēėŽäĒ Ž∂ÄÍįÄÍįÄžĻėžôÄ ž§ĎŽ≥ĶŽźėÍłį ŽēĆŽ¨łžĚīŽč§. Eqs. (5)~(7)žĚÄ ÍįÄž†ēžóźžĄú ŽįúžÉĚŪēėŽäĒ žĚĎͳȎĆÄžĪÖŽĻĄžö©žóź ŽĆÄŪēú žāįž†ēžčĚžĚīŽ©į ÍįÄÍĶ¨Ž≥Ą žĻ®žąėžč¨žóź ŽĒįŽ•ł ž≤≠žÜƞ̾žąėŽäĒ Table 7žóź ž†úžčúŪēėžėÄŽč§.
(5)
(6)
(7)
ÍįÄž†ēžóźžĄú ŽįúžÉĚŪēėŽäĒ ŽĆÄž≤īŪôúŽŹôžóź ŽĒįŽ•ł žßÄž∂úŽ∂ÄŽčī Žč®ÍįÄŽäĒ Table 8žóźžĄú 2014ŽÖĄ Íłįž§Ä žÜĆŽĻĄžěźŽ¨ľÍįÄžßÄžąė(žīĚžßÄžąė)žôÄ 2014ŽÖĄ Íłįž§Ä žõźžóĒŪôėžú®žĚĄ ž†Āžö©Ūēėžó¨ Žč®ÍįÄŽ•ľ žě¨žāįž†ēŪēėžėÄŽč§. ÍįÄž†ēžóźžĄú ŽįúžÉĚŪēėŽäĒ ž≤≠žÜĆŽÖłŽŹôŽĆÄÍįÄŽäĒ 2014ŽÖĄ Íłįž§Ä ŪēúÍĶ≠ŪĎúž§ÄžāįžóÖ Ž∂ĄŽ•ė(9žį®) ž§Ď ‚ÄėN. žā¨žóÖžčúžĄ§ÍīÄŽ¶¨ ŽįŹ žā¨žóÖžßÄžõźžĄúŽĻĄžä§žóÖ‚Äôžóź ŪŹ¨Ūē®ŽźėŽäĒ ŽĻĄž†ēÍ∑ú ž≤≠žÜĆ ŽÖłŽŹôžěźžĚė ŪēėŽ£® žěĄÍłą žīĚžē°žĚĄ ž†Āžö©ŪĖąžúľŽ©į, 2014ŽÖĄžĚė Í≤Ĺžöį žĚľŽčĻ (8žčúÍįĄ) žĶúž†ÄžěĄÍłąžĚÄ 82,668žõźžĚīŽč§. ŽėźŪēú, ž£ľÍĪįÍĪīŽ¨ľ žú†Ūėēžóź ŽĒįŽĚľ 1žłĶžóź ÍĪįž£ľŪēėŽäĒ ÍįÄÍĶ¨žąėŽäĒ ŽĆÄžÉĀ žßÄžó≠ ž£ľÍĪįÍĪīŽ¨ľ žú†ŪėēŽ≥Ą žīĚÍįÄÍĶ¨žąėžóź Žč®ŽŹÖž£ľŪÉĚ 1žłĶ, žēĄŪĆĆŪäł 10žłĶ, žóįŽ¶Ĺ, Žč§žĄłŽĆÄ ž£ľŪÉĚžĚÄ 3žłĶžĚė ŪŹČÍ∑†žłĶžąėŽ•ľ ŽāėŽąĄžĖī žāįž†ēŪēėžėÄŽč§. Eq. (8)žĚÄ žā¨žóÖžě•žĚė ŽĆÄž≤īŪôúŽŹôžóź ŽĒįŽ•ł ž∂ĒÍįÄŽĻĄžö© žāįž†ēžčĚžĚīŽ©į žßÄž∂úŽ∂ÄŽčī žõźŽč®žúĄ Žč®ÍįÄŽäĒ Table 9žóź ŽāėŪÉÄŽāīžóąŽč§.
(8)
Ž≥ł žóįÍĶ¨žóźžĄúŽäĒ žā¨žó֞앞̥ žāįžóÖŪôúŽŹôžĚī žąėŪĖČŽźėÍ≥† žěąŽäĒ ŽĻĄž£ľÍĪįÍĪīŽ¨ľŽ°ú ÍįĄž£ľŪēėÍ≥† žĻ®žąėžßÄžó≠Í≥ľ ž§Ďž≤©Žźú ŽĻĄž£ľÍĪįÍĪīŽ¨ľžĚĄ žĻ®žąėžč¨žóź ŽĒįŽĚľ Ž∂ĄŽ•ėŪēėžó¨ ŽĆÄž≤īŪôúŽŹôžóź ŽĒįŽ•ł žßÄž∂úŽ∂ÄŽčī Žč®ÍįÄŽ•ľ žāįž†ēŪēėžėÄŽč§.
3. ÍįĄž†ĎŪéłžĚĶžĚĄ Í≥†Ž†§Ūēú Í≤Ĺž†úžĄĪ Ž∂ĄžĄĚ ž†Āžö©
3.1 ŽĆÄžÉĀžßÄžó≠ ŽįŹ žā¨žóÖ žĄ†ž†ē
Ž≥ł žóįÍĶ¨žóźžĄúŽäĒ 2014ŽÖĄŽŹĄ ŽŹôŽĎźž≤úžčú ŪĒôžąėŪēīž†ÄÍįźžĘÖŪē©Í≥ĄŪöć Ž≥īÍ≥†žĄúžóźžĄú žĖłÍłČŽźú 5Íįú Ūēėž≤úžě¨ŪēīžúĄŪóėžßÄÍĶ¨žĚė žě¨ŪēīžėąŽį©žā¨žó̥֞ ŽĆÄžÉĀžúľŽ°ú ÍįĄž†ĎŪéłžĚĶžĚĄ Í≥†Ž†§Ūēú Í≤Ĺž†úžĄĪ Ž∂ĄžĄĚžĚĄ žąėŪĖČŪēėžėÄŽč§. Ūēėž≤úžě¨ŪēīžúĄŪóėžßÄÍĶ¨ŽäĒ ÍįĀÍįĀ ÍīĎžēĒž†ú2žßÄÍĶ¨, ŽŹôŽßČž≤úžßÄÍĶ¨, Ž™ĽÍ≥®ž≤úžßÄÍĶ¨, ŽīČŽŹôž≤úžßÄÍĶ¨, žēąŽßźž≤úžßÄÍĶ¨žĚīŽč§. Table 10žĚÄ Ūēėž≤úžě¨ŪēīžúĄŪóėžßÄÍĶ¨Ž≥Ą žúĄžĻė ŽįŹ ž†ÄÍįźŽĆÄžĪÖÍ≥ľ Ūē®ÍĽė žě¨ŪēīžėąŽį©žā¨žóÖŽĻĄžĚė žīĚžē°žĚī Íłįžě¨ŽźėžĖī žěąŽč§. žě¨ŪēīžėąŽį©žā¨žóÖŽĻĄžĚė Í≤Ĺžöį Ūē†žĚłžú® (5.5%)žĚĄ ž†Āžö©Ūēėžó¨ 2014ŽÖĄžĚĄ Íłįž§ÄžúľŽ°ú žóįŽŹĄŽ≥Ą žā¨žóÖŽĻĄŽ•ľ Ūē©žāįŪēú Íłąžē°žĚĄ ŽāėŪÉÄŽāīžóąŽč§. ŪēīŽčĻ Íłąžē°žĚÄ ŽĻĄžö©ŪéłžĚĶ Ž∂ĄžĄĚžóźžĄú ŽĻĄžö©(C)žóź ŪēīŽčĻŪēúŽč§.
3.2 žßÄÍĶ¨Ž≥Ą žě¨ŪēīžėąŽį©žā¨žóÖ Í≤Ĺž†úžĄĪ Ž∂ĄžĄĚ
žēěžóźžĄú žĖłÍłČŪēú 5ÍįúžĚė ŽŹôŽĎźž≤úžčú Ūēėž≤úžě¨ŪēīžúĄŪóėžßÄÍĶ¨Ž•ľ ŽĆÄžÉĀžúľŽ°ú 100ŽÖĄ ŽĻąŽŹĄžĚė žßÄŽį©Ūēėž≤ú, žÜĆŪēėž≤ú žĻ®žąėŪĒľŪēīÍįÄ ŽįúžÉĚŪĖąžĚĄ ŽēĆ žßÄÍĶ¨Ž≥Ą žßĀž†ĎŪĒľŪēīžôÄ ÍįĄž†ĎŪĒľŪēīŽ•ľ žāįž†ēŪēėžėÄŽč§. 100ŽÖĄ ŽĻąŽŹĄ žßÄŽį©Ūēėž≤ú, žÜĆŪēėž≤ú žĻ®žąėžėąžÉĀŽŹĄŽäĒ ŪĖČž†ēžēąž†ĄŽ∂Ä R&D Í≥ľž†úžóźžĄú ž†úžěĎŪēú žßÄŽŹĄŽ•ľ žā¨žö©ŪēėžėÄžúľŽ©į, ÍįĀÍįĀžĚė žßÄÍĶ¨žóźžĄú ŽįúžÉĚŪēėŽäĒ ŪĒľŪēīžē°žĚÄ žě¨ŪēīžėąŽį©žā¨žóÖžĚī žôĄŽ£ĆŽźėŽ©ī 0žĚī ŽźúŽč§Í≥† ÍįÄž†ēŪēėžėÄŽč§. ŽĒįŽĚľžĄú žßÄÍĶ¨ Žāī žĻ®žąėŪĒľŪēīŽ°ú ŽįúžÉĚŪēėŽäĒ ŪĒľŪēīžē°žĚÄ Ž™®ŽĎź ŪéłžĚĶžúľŽ°ú ÍįĄž£ľŪē† žąė žěąŽč§. Ž≥ł žóįÍĶ¨žóźžĄúŽäĒ 2014ŽÖĄŽŹĄžóź 5Íįú žßÄÍĶ¨žóźžĄú 100ŽÖĄ ŽĻąŽŹĄžĚė žßÄŽį©Ūēėž≤ú, žÜĆŪēėž≤ú žĻ®žąėŪĒľŪēīÍįÄ ŽįúžÉĚŪĖąŽč§Í≥† ÍįÄž†ēŪēėÍ≥† ŪéłžĚĶžĚĄ žāįž†ēŪēėžėÄŽč§.
ŽėźŪēú, ŪĒľŪēīžĚė žõźžĚłžĚł žßÄŽį©Ūēėž≤úÍ≥ľ žÜĆŪēėž≤úžĚė žĻ®žąėÍįÄ ž§Ďž≤©ŽźėžĖī ŽįúžÉĚŪēú žßÄžó≠žĚÄ ÍįĀÍįĀžĚė žĻ®žąėžč¨žĚĄ ŽĻĄÍĶźŪĖąžĚĄ ŽēĆ ŽćĒ ŪĀį žĻ®žąėžč¨žúľŽ°ú žĚľÍīĄ ž†Āžö©ŪēėžėÄŽč§. Žč§žĚĆžĚÄ 5ÍįúžĚė Ūēėž≤úžě¨ŪēīžúĄŪóėžßÄÍĶ¨ ž§Ď ŪéłžĚĶžĚī ÍįÄžě• ŪĀ¨Í≤Ć ŽįúžÉĚŪēú žßÄÍĶ¨žôÄ ÍįÄžě• žěĎžĚÄ žßÄÍĶ¨žĚė žěźžāįŽ∂ĄŪŹ¨žôÄ Ūē≠Ž™©Ž≥Ą ŪĒľŪēīžÉĀŪô©žĚĄ ŽāėŪÉÄŽāł Í≤ÉžĚīŽč§.
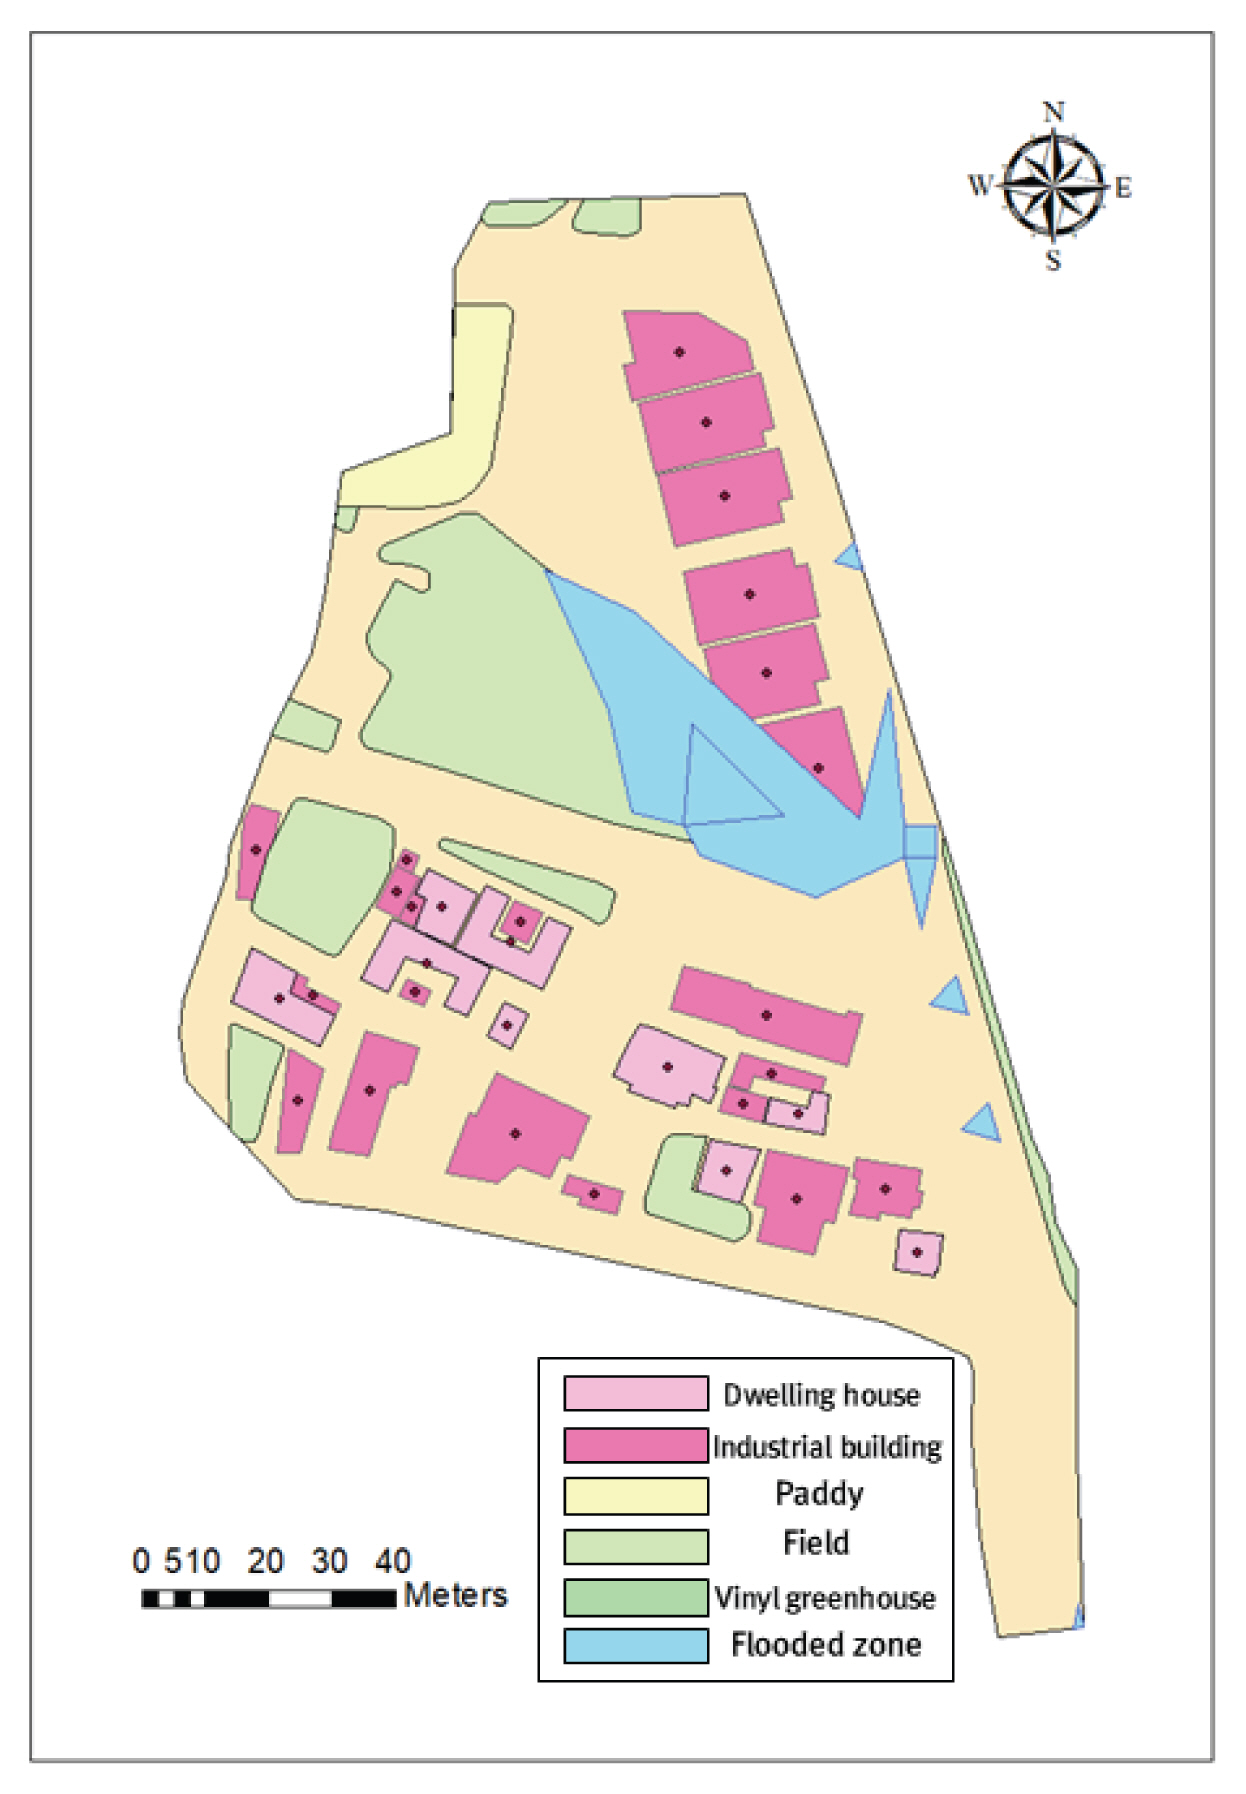
3.2.1 žēąŽßźž≤úžßÄÍĶ¨
žēąŽßźž≤úžßÄÍĶ¨ŽäĒ Žč§Ž•ł 4ÍįúžĚė Ūēėž≤úžě¨ŪēīžúĄŪóėžßÄÍĶ¨žôÄ ŽĻĄÍĶźŪĖąžĚĄ ŽēĆ žßÄÍĶ¨Žāī žĻ®žąėžßÄžó≠žĚī žį®žßÄŪēėŽäĒ ŽĻĄžú®žĚī ž†úžĚľ ŪĀ¨Žč§(Fig. 2). ŽĻĄŽ°Ě Žč§Ž•ł žßÄÍĶ¨žôÄ ŽĻĄÍĶźŪĖąžĚĄ ŽēĆ žßÄÍĶ¨ Žāīžóź žúĄžĻėŪēú ÍĪīŽ¨ľžĚė žąėŽäĒ ŽßéžßÄ žēäžßÄŽßĆ, ÍįÄžě• ŪĀį žĻ®žąėŽ©īž†Ā ŽēĆŽ¨łžóź ž£ľÍĪįÍĪīŽ¨ľ, ŽĻĄž£ľÍĪįÍĪīŽ¨ľžóźžĄú ŪĒľŪēīÍįÄ ŽįúžÉĚŪēėžėÄÍ≥†, žĚīŽäĒ žĚĎͳȎĆÄžĪÖŽĻĄžö©žĚĄ ŪŹ¨Ūē®Ūēú ÍįĄž†ĎŪéłžĚĶžóźŽŹĄ žėĀŪĖ•žĚĄ ž£ľžóąŽč§(Table 11).
ŽėźŪēú, ŪēīŽčĻ žßÄÍĶ¨ŽäĒ žč†ž≤úÍ≥ľ žÜĆŪēėž≤úžóźžĄú ŽįúžÉĚŪēėŽäĒ žĻ®žąėŪĒľŪēīÍįÄ ž§Ďž≤©ŪēīžĄú ŽįúžÉĚŪĖąÍłį ŽēĆŽ¨łžóź žĻ®žąėžč¨žĚī 1 m žĚīžÉĀžĚł Í≤ĹžöįžóźŽßĆ ŪĒľŪēīÍįÄ ŽįúžÉĚŪēėŽäĒ ŽÜćÍ≤ĹžßÄ ŪĒľŪēīžóźŽŹĄ ŪĀį žėĀŪĖ•žĚĄ ž£ľžóąŽč§. ŽĻĄŽ°Ě, žßÄÍĶ¨ Žāīžóź ÍĪįž£ľŪēėŽäĒ žī̞̳ÍĶ¨žąėÍįÄ ž†ĀžĖī žĚłŽ™ÖŪĒľŪēīžôÄ žĚīžě¨ŽĮľ ŪĒľŪēīÍįÄ ŽįúžÉĚŪēėžßÄŽäĒ žēäžēėžßÄŽßĆ, Žč§Ž•ł žßÄÍĶ¨žôÄ ŽĻĄÍĶźŪĖąžĚĄ ŽēĆ ÍĪīŽ¨ľÍ≥ľ ŽÜćÍ≤ĹžßÄ, ŽÜćžěĎŽ¨ľ, Í≥ĶÍ≥ĶžčúžĄ§Ž¨ľžóźžĄú ŽĎźŽďúŽü¨žßĄ žį®žĚīŽ•ľ Ž≥īžėÄŽč§.
3.2.2 ÍīĎžēĒž†ú2žßÄÍĶ¨
ÍīĎžēĒž†ú2žßÄÍĶ¨ŽäĒ žēąŽßźž≤úžßÄÍĶ¨žôÄ ŽĻĄÍĶźŪĖąžĚĄ ŽēĆ, žßÄÍĶ¨ Žāīžóź ÍĪīŽ¨ľžĚī žį®žßÄŪēėŽäĒ ŽĻĄžú®žĚÄ Žß§žöį ŪĀ¨žßÄŽßĆ, žßÄŽį©Ūēėž≤úžĚł ŽŹôŽĎźž≤úžóźžĄú ŽįúžÉĚŪēėŽäĒ žĻ®žąėŪĒľŪēīÍįÄ ÍĶ≠žÜĆžßÄžó≠žóźžĄúŽßĆ žėĀŪĖ•žĚĄ ž£ľÍ≥† žěąŽč§(Fig. 3). ŪēúÍĶ≠Ūėē žÜźžÉĀ‚č֞ܟžč§Ūē®žąėžóźžĄú ÍĪīŽ¨ľŪĒľŪēīŽäĒ ÍĪīŽ¨ľ ŪŹīŽ¶¨Í≥§žĚė ž§Ďžč¨ž†źžĚī žĻ®žąėžßÄžó≠Í≥ľ ž§Ďž≤©ŽźėžĖīžēľ ŪĒľŪēīÍįÄ žĚľžĖīŽāú Í≤ÉžúľŽ°ú ÍįĄž£ľŪēúŽč§. Í∑łŽü¨ŽĮÄŽ°ú ÍīĎžēĒž†ú2žßÄÍĶ¨žóźžĄú ÍĪīŽ¨ľ ŽįŹ ÍĪīŽ¨ľ Žāīžö©Ž¨ľ ŪĒľŪēīžē°žĚÄ ŽįúžÉĚŪēėžßÄ žēäžēėžúľŽ©į, Žį≠Í≥ľ ž§Ďž≤©Žźú žĻ®žąėžßÄžó≠žĚė žĻ®žąėžč¨ŽŹĄ žěĎžēėÍłį ŽēĆŽ¨łžóź ŽÜćÍ≤ĹžßÄ ŪĒľŪēīžē°ŽŹĄ ŽįúžÉĚŪēėžßÄ žēäžēėŽč§. žĚīžóź ŽĒįŽĚľ ÍīÄŽ†®Žźú ÍįĄž†ĎŪéłžĚĶŽŹĄ žāįž∂úŽźėžßÄ žēäžēĄ, 5ÍįúžĚė Ūēėž≤úžě¨ŪēīžúĄŪóėžßÄÍĶ¨ ž§Ď ÍįÄžě• ŽāģžĚÄ žīĚŪéłžĚĶžĚī ŽįúžÉĚŪēėžėÄŽč§(Table 12).
3.3 žßÄÍĶ¨Ž≥Ą žě¨ŪēīžėąŽį©žā¨žóÖ Í≤Ĺž†úžĄĪ Ž∂ĄžĄĚ Í≤įÍ≥ľ
5ÍįúžĚė Ūēėž≤úžě¨ŪēīžúĄŪóėžßÄÍĶ¨žóźžĄú žčúŪĖČŽźú žě¨ŪēīžėąŽį©žā¨žóÖžĚė Í≤Ĺž†úžĄĪžĚĄ Ž∂ĄžĄĚŪēú Í≤įÍ≥ľŽäĒ Table 13Í≥ľ ÍįôŽč§. B/CÍįížĚĄ žāįž∂úŪēú Í≤įÍ≥ľ žēąŽßźž≤úžßÄÍĶ¨, Ž™ĽÍ≥®ž≤úžßÄÍĶ¨, ŽīČŽŹôž≤úžßÄÍĶ¨, ŽŹôŽßČž≤úžßÄÍĶ¨, ÍīĎžēĒž†ú2žßÄÍĶ¨ žąúžúľŽ°ú B/CÍįížĚī ŽÜížēėžúľŽ©į, žēąŽßźž≤úžßÄÍĶ¨žĚė Í≤Ĺžöį B/CÍįížĚī 0.08Ž°ú ÍįÄžě• ŽÜížēėŽč§. žĚłŽ™ÖŪĒľŪēīŽäĒ 5Íįú žßÄÍĶ¨ Ž™®ŽĎź ŽįúžÉĚŪēėžßÄ žēäžēėŽäĒŽćį, ŽÖłž∂úžúĄŪóėžĚłÍĶ¨žąėžóźžĄú žĚłŽ™ÖŪĒľŪēī ŽįúžÉĚŪôēŽ•†žĚĄ ž†Āžö©Ūēėžó¨ ŪĒľŪēīžĚłÍĶ¨žąėŽ•ľ žāįž†ēŪēėŽäĒ ŪēúÍĶ≠Ūėē žÜźžÉĀ‚č֞ܟžč§Ūē®žąėžĚė ŪäĻžĄĪžÉĀ Í∑ĻŽč®ž†ĀžĚł žÉĀŪē≠žĚī žēĄŽčąŽĚľŽ©ī žßÄÍĶ¨Žč®žúĄžĚė žÜĆÍ∑úŽ™® žßÄžó≠žóźžĄúŽäĒ žĚłŽ™ÖŪĒľŪēīÍįÄ ŽįúžÉĚŪēėžßÄ žēäÍłį ŽēĆŽ¨łžĚīŽč§. žĚīžě¨ŽĮľŪĒľŪēīŽäĒ žĚłŽ™ÖŪĒľŪēīŽ≥īŽč§ ŽįúžÉĚŪôēŽ•†žĚÄ ŽÜížßÄŽßĆ, žĚī žó≠žčúŽŹĄ ž∂©Ž∂ĄŪēú ž£ľÍĪįÍĪīŽ¨ľžĚī žěąŽäĒ žßÄÍĶ¨žóźžĄú ŽĄďžĚÄ Ž©īž†ĀžĚė žĻ®žąėÍįÄ žĚľžĖīŽāėžēľ ŽįúžÉĚŪēúŽč§. žėąŽ•ľ Žď§žĖī ŽŹôŽßČž≤úžßÄÍĶ¨ŽäĒ ÍĪīŽ¨ľŽ©īž†Ā ÍłįŽįėžĚė žßĎÍ≥ĄÍĶ¨ žĚłÍĶ¨ŽįÄŽŹĄŽ•ľ žā¨žö©Ūēú Í≥ĶÍįĄŽ∂ĄžĄĚžĚĄ ŪÜĶŪēī 583Ž™ÖžĚė žī̞̳ÍĶ¨žąėÍįÄ ÍĪįž£ľŪēúŽč§ŽäĒ Í≤įÍ≥ľŽ•ľ žĖĽžóąžßÄŽßĆ, žĘĀžĚÄ Ž≤ĒžúĄžóź Ūēúž†ēŪēīžĄú žĻ®žąėÍįÄ ŽįúžÉĚŪĖąÍłį ŽēĆŽ¨łžóź žĚīžě¨ŽĮľžĚÄ ŽįúžÉĚŪēėžßÄ žēäžēėŽč§. Í≤įŽ°†ž†ĀžúľŽ°ú ÍįĄž†ĎŪéłžĚĶžĚĄ ŽįėžėĀŪēú žßÄÍĶ¨Žč®žúĄžĚė žě¨ŪēīžėąŽį©žā¨žóÖ Í≤Ĺž†úžĄĪ Ž∂ĄžĄĚžĚĄ žąėŪĖČŪēú Í≤įÍ≥ľ žĚĎͳȂčÖžě•Íłį ÍĶ¨ŪėłŽĻĄ, žÉĚÍ≥ĄžßÄžõźŽĻĄžôÄ ÍįôžĚī žā¨žÉĀžěźžąė, žĚīžě¨ŽĮľžąėŽ•ľ ŽįėžėĀŪēú ŪéłžĚĶ Ūē≠Ž™©Ž≥īŽč§ žėĀžóÖž†ēžßÄ‚čÖž†ēž≤ī ŪĒľŪēīžē°, žĚĎͳȎĆÄžĪÖŽĻĄžö© ŽďĪžĚė Ūē≠Ž™©žĚī B/CÍįí Í≤įÍ≥ľ ŽŹĄž∂úžóź ŽćĒ žú†žĚėŽĮłŪēú žėĀŪĖ•žĚĄ ž£ľžóąŽč§.
4. Í≤į Ž°†
žě¨ŪēīžėąŽį©žā¨žóÖŽ≥ĄŽ°ú žčúŪĖČŽźėŽäĒ Ūą¨žěźžöįžĄ†žąúžúĄ Ž∂ĄžĄĚžóźžĄú Ūö®žú®žĄĪ Ūē≠Ž™©žúľŽ°ú Ž∂ĄŽ•ėŽźú Í≤Ĺž†úžĄĪŽ∂ĄžĄĚžóźžĄúŽäĒ B/CÍįížĚī ŽćĒ ŽÜížĚÄ žā¨žó֞̾žąėŽ°Ě Ūö®žú®ž†ĀžĚł Ūą¨žěźŽ°ú ÍįĄž£ľŪēúŽč§. ŪēėžßÄŽßĆ, Íłįž°ī Í≤Ĺž†úžĄĪ ŪŹČÍįÄŽ™®ŪėēžóźžĄú ž†ēŽįÄŽŹĄžôÄ ž†ēŪôēŽŹĄŽ•ľ ŽÜížĚł ŪēúÍĶ≠Ūėē žÜźžÉĀ‚č֞ܟžč§Ūē®žąėŽ•ľ ž†Āžö©Ūēú Í≤įÍ≥ľ 5Íįú žßÄÍĶ¨ Ž™®ŽĎźÍįÄ 1Ž≥īŽč§ žěĎžĚÄ B/CÍįížĚī ŽŹĄž∂úŽźėžóąŽč§. žĚľŽįėž†ĀžúľŽ°ú B/CÍįížĚī 1žĚīžÉĀžĚīžĖīžēľ žā¨žóÖ ŪÉÄŽčĻžĄĪžĚī žěąŽč§Í≥† ŪŹČÍįÄŽźėŽäĒŽćį, ŽŹĄž∂úŽźú Í≤įÍ≥ľŽ•ľ Ž∂ĄžĄĚŪēėžó¨ Žč§žĚĆÍ≥ľ ÍįôžĚÄ Í≤įŽ°†žĚĄ žĖĽžóąŽč§.
ž≤ęžßłŽ°ú žßÄÍĶ¨Žč®žúĄ ŪĒľŪēīžßÄžó≠žóź ž†Āžö©ŪĖąžĚĄ ŽēĆ žßĀž†ĎŪéłžĚĶžĚī ŽāģÍ≤Ć žāįž†ēŽźėžóąÍłį ŽēĆŽ¨łžĚīŽč§. ÍĪīŽ¨ľžĚė Í≤Ĺžöį ž§Ďžč¨ž†ź Žį©žč̞̥ žā¨žö©Ūēėžó¨ ÍĪīŽ¨ľžĚė ž§Ďžč¨ž†źžóź ŪēīŽčĻŪēėŽäĒ ŪŹ¨žĚłŪäłžôÄ žĻ®žąėžėąžÉĀŽŹĄžĚė ž§Ďž≤©žó¨Ž∂Äžóź ŽĒįŽĚľ žĻ®žąėŪĒľŪēī žó¨Ž∂ÄŽ•ľ ŪĆźŽč®ŪĖąÍłį ŽēĆŽ¨łžóź žßÄÍĶ¨ Žč®žúĄ žÜĆÍ∑úŽ™® žßÄžó≠žóźžĄúŽäĒ ÍĪīŽ¨ľ ŪĒľŪēīÍįÄ ŽāģÍ≤Ć žāįž†ēŽźėžóąŽč§. ŽėźŪēú, Í≥ĶÍ≥ĶžčúžĄ§Ž¨ľ ŪĒľŪēīžē°žóźžĄúŽŹĄ ÍĶźŽüČ, ŽŹĄžčúžčúžĄ§, Í≥ĶžĚĶ, ŽÜćžßÄ ŽďĪ Žč§žĖĎŪēú Í≥ĶÍ≥ĶžčúžĄ§Ž¨ľ ž§Ď Ž≥ł žóįÍĶ¨žóźžĄúŽäĒ ŽŹĄŽ°úžčúžĄ§Ž¨ľÍ≥ľ žÉĀ‚čÖŪēėžąėŽŹĄžčúžĄ§Ž¨ľ ŪĒľŪēīžē°ŽßĆ Í≥†Ž†§ŪēėžėÄÍłį ŽēĆŽ¨łžóź žßĀž†ĎŪĒľŪēīžē°žĚī ŽāģÍ≤Ć žāįž†ēŽźėžóąŽč§. ŽĎėžßłŽäĒ, ÍįĄž†ĎŪéłžĚĶ Ūē≠Ž™© ŽĻĄž§ĎžĚī ŽāģÍłį ŽēĆŽ¨łžĚīŽč§. Ž≥ł žóįÍĶ¨žóźžĄú žēąŽßźž≤ú žßÄÍĶ¨žôÄ ŽīČŽŹôž≤úžßÄÍĶ¨žóźžĄú žßĀž†ĎŪéłžĚĶ ŽĆÄŽĻĄ ÍįĄž†ĎŪéłžĚĶžĚė ŽĻĄž§ĎžĚÄ ÍįĀÍįĀ 3.51Žįį(žßĀž†ĎŪéłžĚĶ 55,904(ž≤úžõź), ÍįĄž†ĎŪéłžĚĶ 196,608(ž≤úžõź), 2.36Žįį(žßĀž†ĎŪéłžĚĶ 18,580(ž≤úžõź), ÍįĄž†ĎŪéłžĚĶ 43,926(ž≤úžõź))Ž°ú ŽŹĄž∂úŽźėžóąžßÄŽßĆ, ŽŹôžĚľŪēú žßÄžó≠žóź Žč§žį®žõźŽ≤ēžĚĄ ž†Āžö©Ūēėžó¨ žāįž†ēŪĖąžĚĄ ŽēĆžóźŽäĒ 5~9%žĚė ŽĻĄž§ĎžĚĄ žį®žßÄŪĖąŽč§. žßĀž†ĎŪéłžĚĶžĚī ŽāģÍ≤Ć žāįž†ēŽźėžĖī ÍįĄž†ĎŪéłžĚĶžĚī ŪĀ¨Í≤Ć žāįž†ēŽźú Í≤ÉžúľŽ°ú Ž≥īžĚīžßÄŽßĆ žĚľŽįėž†ĀžúľŽ°ú B/C ÍįížĚī ž†úŽĆÄŽ°ú ŽŹĄž∂úŽźėÍłį žúĄŪēīžĄúŽäĒ ž∂ĒÍįÄž†ĀžĚł ÍįĄž†ĎŪéłžĚĶ Ūē≠Ž™©žĚė ŽįėžėĀžĚī ŪēĄžöĒŪēėŽč§. žĚī Ž¨łž†úŽäĒ Ž≥ł žóįÍĶ¨žĚė ŪēúÍ≥Ąž†źžĚīŽĚľ Ūē† žąė žěąŽč§.
ž†ēŽ∂Ğ󟞥úŽäĒ žě¨ŪēīžėąŽį©žā¨žóÖžóź ŽĆÄŪēú Ūą¨žěźžöįžĄ†žąúžúĄŽ•ľ Í≤įž†ēžčú ž†ēŽüČž†ĀžĚł ÍįÄžĻėŽŅźŽßĆ žēĄŽčąŽĚľ ž†ēžĄĪž†ĀžĚł ÍįÄžĻėŽŹĄ Žč§Žį©Ž©īžúľŽ°ú Í≥†Ž†§ŪēúŽč§. ÍįĄž†ĎŪéłžĚĶ Ūē≠Ž™©žĚÄ Í∑łŽŹôžēą žā¨žóÖžóź ŽĆÄŪēú Ūą¨žěźžöįžĄ†žąúžúĄŽ•ľ Í≤įž†ēŪē† ŽēĆ Í≥†Ž†§ŽźėžßÄ Ž™ĽŪĖąŽćė žě¨ŪēīžėąŽį©žā¨žóÖžĚė žą®Í≤®žßĄ ŪéłžĚĶŪē≠Ž™©žúľŽ°ú Ž≥ľ žąė žěąŽč§. Ž≥ł žóįÍĶ¨žóźžĄúŽäĒ žĚłŽ™ÖŪĒľŪēīžôÄ žĚīžě¨ŽĮľŪĒľŪēī, ÍįÄž†ē ŽįŹ žāįžó֞󟞥ú žú†ŽįúŽźėŽäĒ ÍįĄž†ĎŪéłžĚĶ Ūē≠Ž™©žĚĄ Žč§Ž£®žóąžßÄŽßĆ, žč§ž†úŽ°ú ÍįĀ Ž∂ĄžēľŽ≥ĄŽ°ú žāįž†ēŪē† žąė žěąŽäĒ ÍįĄž†ĎŪéłžĚĶžĚÄ Žß§žöį Žč§žĖĎŪēėŽ©į(Hyun and Kim, 2017), žě¨ŪēīŽ°ú žú†ŽįúŽźėŽäĒ ž†ēžč†ž†Ā ŪĒľŪēī, žĻ®žąėŽ°ú žĚłŪēú ÍĶźŪÜĶŽĎźž†ą ž†ąÍįźŪéłžĚĶ, ŪôėÍ≤Ĺžė§žóľŽ¨ľžßą ž†ÄÍįźŪéłžĚĶ ŽďĪžĚī žěąŽč§. Ž≥ł žóįÍĶ¨žóźžĄúŽäĒ ÍįĄž†ĎŪéłžĚĶžĚĄ žāįž†ēŪē† ŽēĆ ÍĪīŽ¨ľ ŽāīŽ∂ÄžĻ®žąėžč¨Ž≥Ą žėĀžóÖž†ēžßÄ‚čÖž†ēž≤īžĚľžąė, ÍįÄž†ēžóźžĄú ŽĆÄž≤īŪôúŽŹôžóź ŽĒįŽ•ł žßÄž∂úŽ∂ÄŽčī Žč®ÍįÄžôÄ ÍįôžĚī žĚľŽ≥łžóźžĄú žā¨žö© ž§ĎžĚł ŪĒľŪēīžĚľžąė ŽįŹ žõźŽč®žúĄ Žč®ÍįÄŽ•ľ žįłÍ≥†ŪēėžėÄžßÄŽßĆ, ž∂ĒŪõĄ žßÄÍĶ¨Žč®žúĄ žě¨ŪēīžėąŽį©žā¨žóÖžóź ŽĆÄŪēú Í≤Ĺž†úžĄĪ Ž∂ĄžĄĚžĚĄ žąėŪĖČŪē† ŽēĆ, ŪēúÍĶ≠Ūėē žõźŽč®žúĄ Žč®ÍįÄ, žėĀžóÖž†ēžßÄ‚čÖž†ēž≤īžĚľžąė ŽďĪžĚĄ ŽŹĄžěÖŪēėÍ≥† ŽĻĄž§ĎžĚī ŪĀį ÍįĄž†ĎŪéłžĚĶ Ūē≠Ž™©žĚĄ Ž™®Ūėēžóź ŽįėžėĀŪēėŽ©ī ÍįúžĄ†Žźú Í≤įÍ≥ľŽ•ľ žĖĽžĚĄ žąė žěąžĚĄ Í≤ÉžĚīŽč§.