


1. INTRODUCTION
Flood risk is traditionally expressed in terms of expected damages and likelihood of occurrence. The flood damage is combined with information on the probability of the flood event and then plotted as return period-damage curve (Apel et al., 2004; Meyer et al., 2009). However, developing countries, do not have enough data needed to assess flood risk using damage (Birkmann, 2007; Gall, 2007). Flood management cannot become technically controllable without a proper assessment of flood hazard mapping and flood hazard (Gigović et al., 2017). However, flood hazard itself only assesses the extent and depth of flood; it does not assess the consequences on the population, economy and environment, as flood risk assessment does (Rincón et al., 2018). In general, risk refers to the expected losses (in terms of fatalities, or in economic terms as damage to property) of a specific hazard to a specific element (e.g., evacuation center) at risk in a particular future time period or future scenarios (Albano et al., 2017).
All disasters have a spatial component and therefore adequate geographic information in hazards and areas vulnerable to hazards is required in order to prepare for disasters (Ouma and Tateishi, 2014). Geographic Information System (GIS) does not only generate a visualization of flooding, but also create potential to further analyze these events to estimate probable damage due to floods. Compared to traditional mapping, GIS enables the comparison across spatial units; comparison across different themes by category of hazard and disasters; merging of qualitative and quantitative assessment and spatial database, based on which logical and/or numerical operations can be dynamically performed. GIS, therefore has an important function to play in natural hazard analyses because natural hazards are multi-dimensional phenomena, which have spatial component (Coppock, 1995).
The combination of multi-criteria decision technique within a GIS mapping environment allows integrating the four components of risk assessment (hazard, exposure, vulnerability and coping capacity), in which urban-specific vulnerability factors including physical, social, economic and environmental can be considered. There are numerous methods for assessing the weights of criterion. Multi-criteria analysis method such as AHP (Saaty, 1980) provides a framework which can handle different views on the identification of the elements of a complex decision problem, organize the elements into a hierarchical structure, and study the relationships among components of the problem (Boroushaki and Malczewski, 2010).
Rincon et al. (2018) used GIS-based multi-criteria decision making (MCDM) to develop flood risk map for the greater Toronto area. They used AHP in calculating the weights of the criterion for the three components of flood risk: hazard, exposure and vulnerability. AHP has been applied in spatial modeling of flood risk assessment in the Philippines, specifically in municipality of Enrile (Siddayao et al., 2014) and city of Tuguegarao (Siddayao et al., 2015) in the province of Cagayan.
In this study, a 10m grid flood risk map for a 25-yr return period event was generated. Flood risk was calculated considering four components: hazard, exposure, vulnerability and coping capacity. The objective of this study is to provide an assessment of the adequacy of the pre-determined evacuation centers using flood risk information considering urban characteristics such as physical, social, economic, and environmental factors. The location of the pre-determined evacuation centers will be overlaid the resulting different levels of flood risk in spatial maps using geographic information system (GIS).
2. METHODOLOGY
2.1 Study Area
The National Capital Region (NCR) of the Philippines or more widely known as Metro Manila has 17 local government units (LGUs) as listed in Table 1. It is composed of sixteen independent cities, classified as highly urbanized cities, and one independent municipality. NCR, with an area of 619.57 km2, has a population of 12,877,253, making it the second most populous region in the Philippines.
One of the most devastating flood disasters happened on September 2009 when Typhoon Ondoy (Typhoon Ketsana) struck southwest Luzon in the Philippines. Flood disasters caused by the continuous heavy rainfall affected 872, 097 people throughout the entire Metro Manila region, causing 241 fatalities, 394 injuries and damaging 65,521 buildings (of which 12,562 were completely destroyed) (Nakasu et al., 2011).
2.2 Conceptual Framework
There are several conceptual frameworks for assessing the structure of flood risk. This study follows that of Davidson (1997), adopted by Bollin et al. (2003). This conceptual framework views risk as the sum of hazard, exposure, vulnerability minus capacity measures as shown in Eq. (1).
The formula used for defining the components of flood risk namely hazard, exposure, vulnerability and coping capacity are listed in Eqs. (2)–(5), where H = hazard index, E = exposure index, V = vulnerability index, C = coping capacity index; α, β, γ, δ = global weight for hazard, exposure, vulnerability and coping capacity, respectively; and ai, bi, ci, di = local weights for hazard, exposure, vulnerability and coping capacity, respectively.
A set of indicators (Hi, Ei, Vi, and Ci) were selected based on availability of data and review of previous studies and are listed in Table 2. The global, local and indicator weights were calculated using Analytical Hierarchy Process (AHP) by Saaty (1980).
2.3 Data collection
Most of the date used in this study were gathered and collected from government agencies such as the Philippine Statistical Authority (PSA), Philippine Atmospheric, Geophysical and Astronomical Services Administration (PAGASA), and Bureau of Local Government Finance (BLGF). Several available GIS data from LiDAR Portal for Archiving and Distribution (LiPAD), PhilGIS and Humanitarian Data Exchange (HDX) were also used. Areas that were not assessed by the University of the Philippines Disaster Risk and Exposure Assessment for Mitigation (UP DREAM) Program during the development of the flood hazard map has no data. Hence, these areas were also not assessed in this study.
Since the data were gathered in different ways and have varying formats and quantitative measures, pre-processing is necessary to standardize the data. In MCDM, standardization is needed to obtain a common scale. There are several standardization methods such as fuzzy logic concept (Gigović et al., 2017), vector normalization, and logarithmic normalization (Vafaei et al., 2016). However, in this research, the z-score standardization technique was used due to its simplicity and reliability.
Most of the gathered data were figures and values from government reports. These administrative data were converted into shapefiles. Then the shapefile was transformed into a 10m grid raster. Other necessary pre-processing steps such as resampling (used to ensure the consistency in grid sizes) and extraction (used to change the extent of work) were also used whenever necessary.
As for the data needed for the calculation of the global, local and indicator weights, a survey questionnaire was distributed to 12 respondents comprising of engineers, municipal risk reduction officers, academe, government employees and medical personnel. In order to integrate their individual responses, a geometric mean was calculated for each indicator.
2.4 AHP Analysis
Analytical hierarchy process (AHP) was used to calculate the weights for the different indicators that were considered in this study. The required number of respondents that were consulted for the evaluation of the criteria weights are varying from six experts (Gigović et al., 2019), ten experts (Gigović et al., 2017), 16 experts (Ouma and Tateishi, 2014) and 38 experts (Kil et al., 2016). Komi et al. (2016) has used one questionnaire per community which was completed by only knowledgeable people (members of the local development committee, formal community leaders, teacher, etc.). For the AHP analysis of this study, a total of 12 respondents were selected from different fields including academe, engineering, government employees, local disaster risk reduction officers, rescue personnel and doctors. Survey was launched using both printed questionnaires and online survey forms.
In AHP, Pairwise Comparison Method (PCM) is used to obtain weight or priority vector of the of the criteria. Saaty (1980) employed a numerical scale from 1 to 9 in order to evaluate relative importance between two criteria. The respondents’ judgment is then transferred to a Pairwise Comparison matrix A. Each numerical value rij of A represents the relative importance of the ith indicator in comparison with the jth indicator. If rij > 1, then the ith indicator is more important than the jth indicator, whereas if rij < 1, the ith indicator is less important than the jth indicator. If the two indicators have the same importance, then rij = 1. The numerical values satisfy the condition given by Eq. (6):
After building the matrix A, a normalized pairwise comparison matrix was derived by dividing each value of rij by the sum of all values of that column. Finally, the relative weights (wAHP) vector was estimated by averaging the values on each row of the normalized pairwise comparison matrix.
The AHP method provides the possibility to check the consistency of the estimated weights. This is done with the consistency ratio (CR) shown in Eq. (7):
where CI is the consistency index and is calculated using Eq. (8):
where λmax is the largest eigenvalue of the matrix and n is the number of indicators. RI is a constant that depends on n as shown in Table 3. When CR < 0.1, the evaluation is consistent, and reliable results can be expected from the AHP model.
2.5 Spatial Mapping of Flood Risk
The calculated weights from the AHP analysis is then used to spatially distribute the flood risk. Most of the existing water facilities such as drainage system in Metro Manila were designed using a 25-yr return period rainfall. Therefore, a flood risk map based from the 25-yr flood depth can be used to assess the existing water facilities in the region. Since the selected indicators have different units of measurement, an initial standardization is performed using z-score method. This pre-processing method for the raw indicator values hence made the range of mean and standard deviation equal to 0 and 1, respectively.
After calculating the flood risk using Eq. (1), the different levels of flood risk were again standardized using z-score method, then were spatially mapped in GIS using raster calculator and overlay function. After which, the predetermined evacuation centers from DROMIC were plotted on the developed flood risk map.
3. RESULTS AND DISCUSSION
3.1 Computation of AHP Pairwise Matrix and Consistency Ratio
Table 4 shows the calculated global and local weights for the components and indicators from the AHP analysis. An example of a pairwise matrix for the response of a 50-yr old male government employee can be found in the Appendix. The calculation for the component and indicator weights as well as the calculation for the consistency ratio for his response can also be seen in the Appendix. Based on the survey responses, among the components, exposure has the highest local weight with a value of 0.37. It is followed by vulnerability, hazard and coping capacity with values of 0.26, 0.21 and 0.16, respectively. For the indicators’ local weights, the value ranges from 0.10 – 0.67.
The global weight was calculated by multiplying the local weight of the indicator with its corresponding component’s local weight. Resulting global weights ranges from 0.0256 – 0.1998. The five highest-ranked indicators were number of housing (0.1998), flood depth (0.1407), elevation (0.1092), locally sourced revenue (0.1036) and total precipitation (0.0693). The consistency ratios listed on the last column of Table 4 indicates that the integrated respondent’s judgment is very consistent since the CR values are all less than 0.10. The CR value equivalent to zero (0) for hazard indicates perfect consistency (Saaty, 1977). This was achieved since only two factors were considered for the hazard category. Hence, the judgement of the respondents for the pairwise comparison matrix is very consistent.
3.2 Flood Risk Mapping
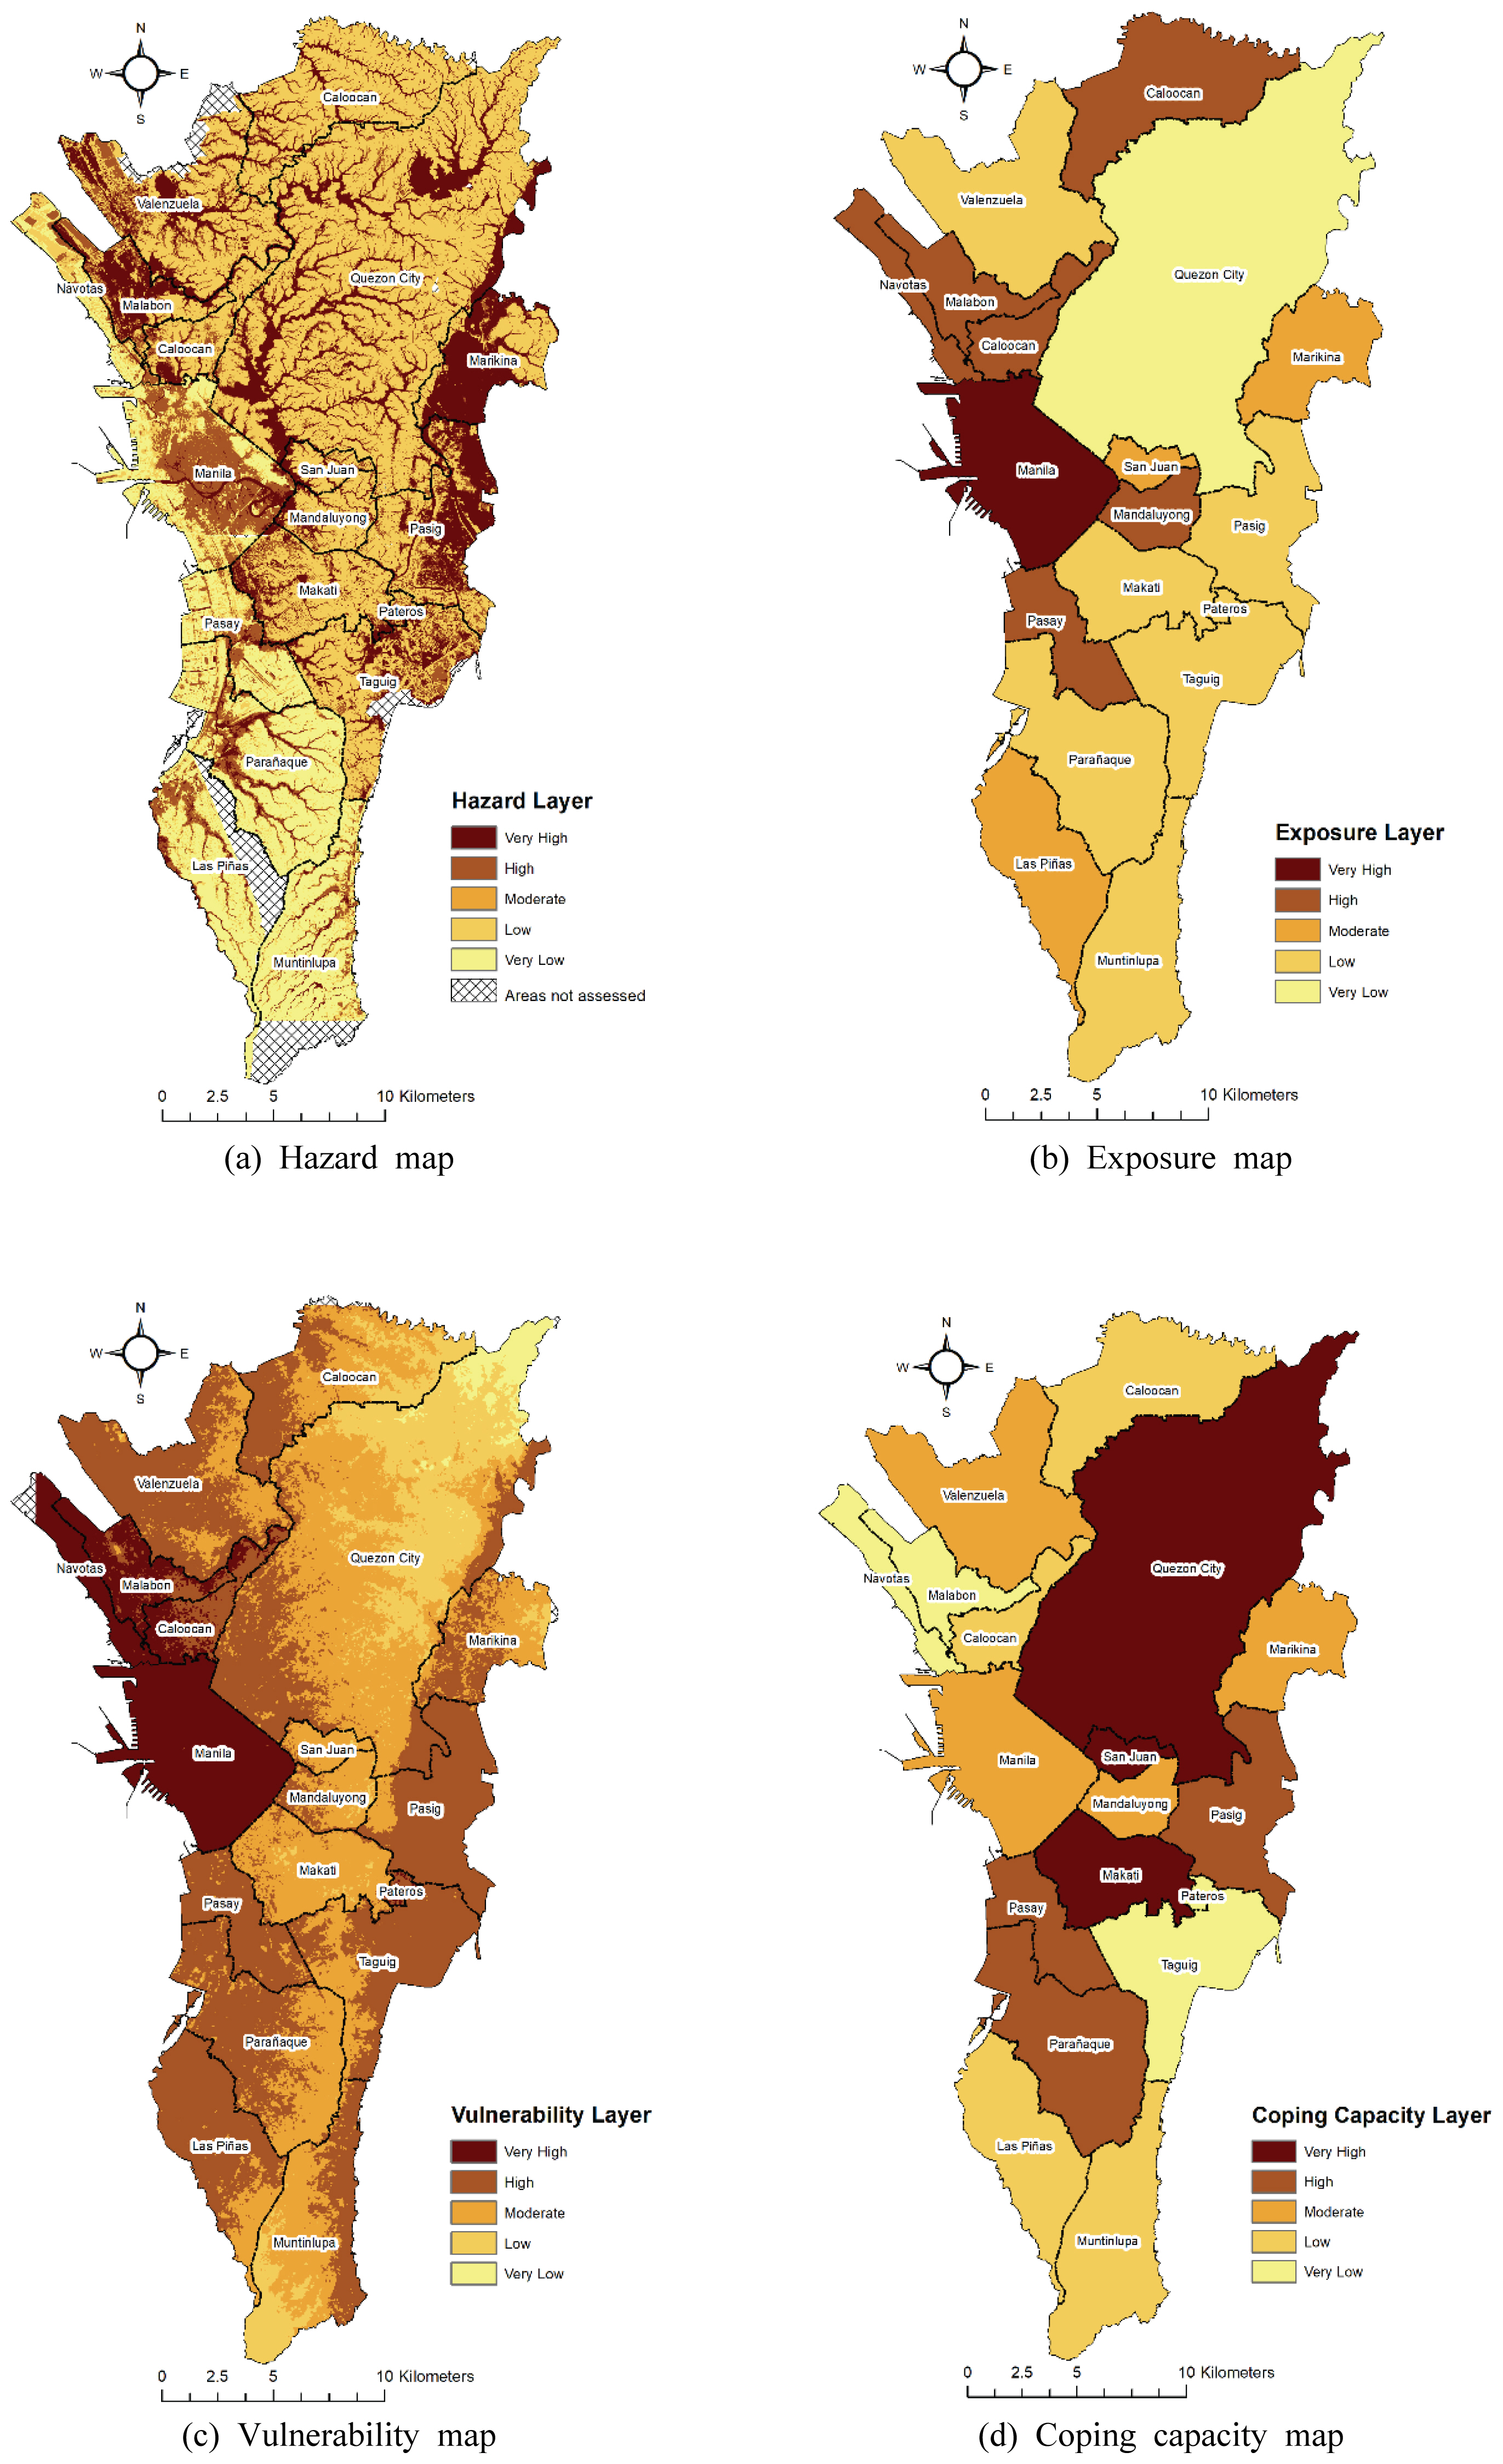
The calculated indicator weights were used to spatially layout the components of flood risk using linear combination. Fig. 1 shows the spatial maps of flood hazard, exposure, vulnerability and coping capacity of Metro Manila. Fig. 1a shows that the areas near the water bodies and low-lying areas have the highest flood hazard. In terms of flood exposure, Manila has very high value while Quezon City has very low value (Fig. 1b). Manila’s very high exposure could be attributed to its high number of housing units and population density. For flood vulnerability, Manila scored very high values as implied in Fig. 1c. Very high values could also be observed in some areas of Caloocan, Malabon, and Navotas. This is because these areas have low elevation and high values of poverty index, vulnerable population and impervious area. As for the coping capacity, Fig. 1d illustrates that Makati and Quezon City has very high value. This can be attributed to the fact that these cities both have high annual regular income and enough number of medical personnel. Very low coping capacity values were observed at Taguig, Malabon and Navotas area.
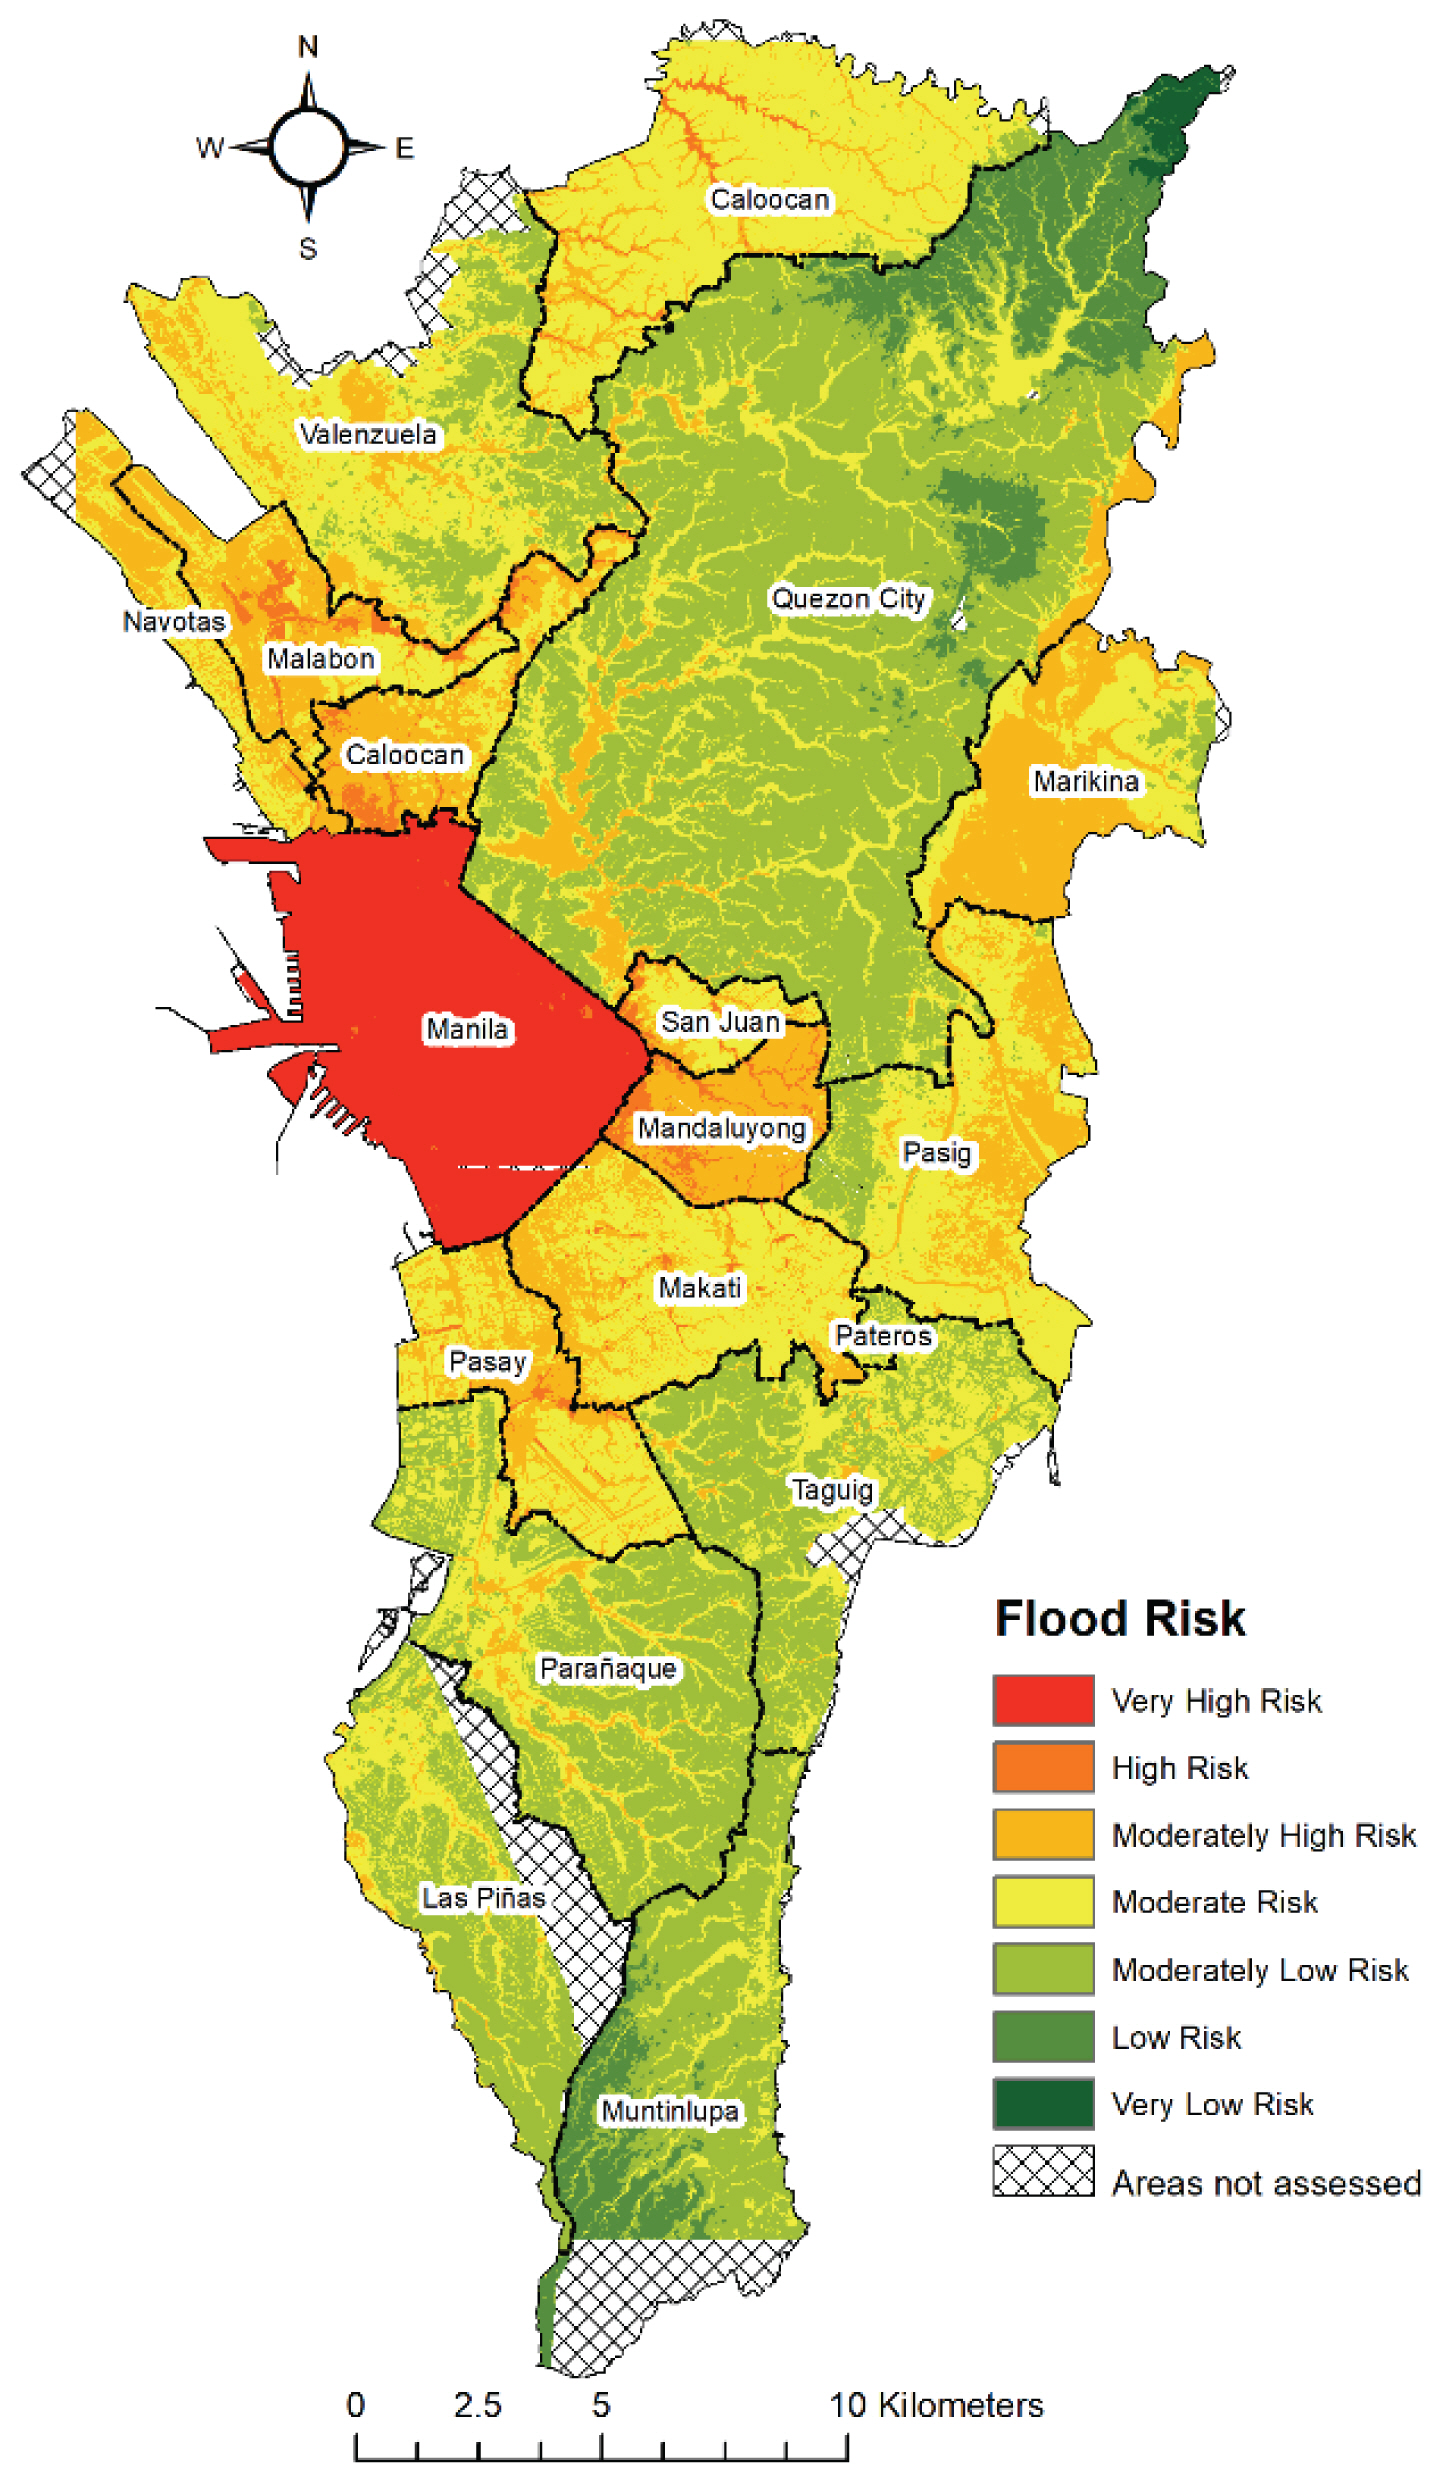
Fig. 2 shows the 25-yr flood risk index for Metro Manila. The resulting flood risk index was divided into seven classifications namely very low risk, low risk, moderately low risk, moderate risk, moderately high risk, high risk and very high risk as listed in Table 5.
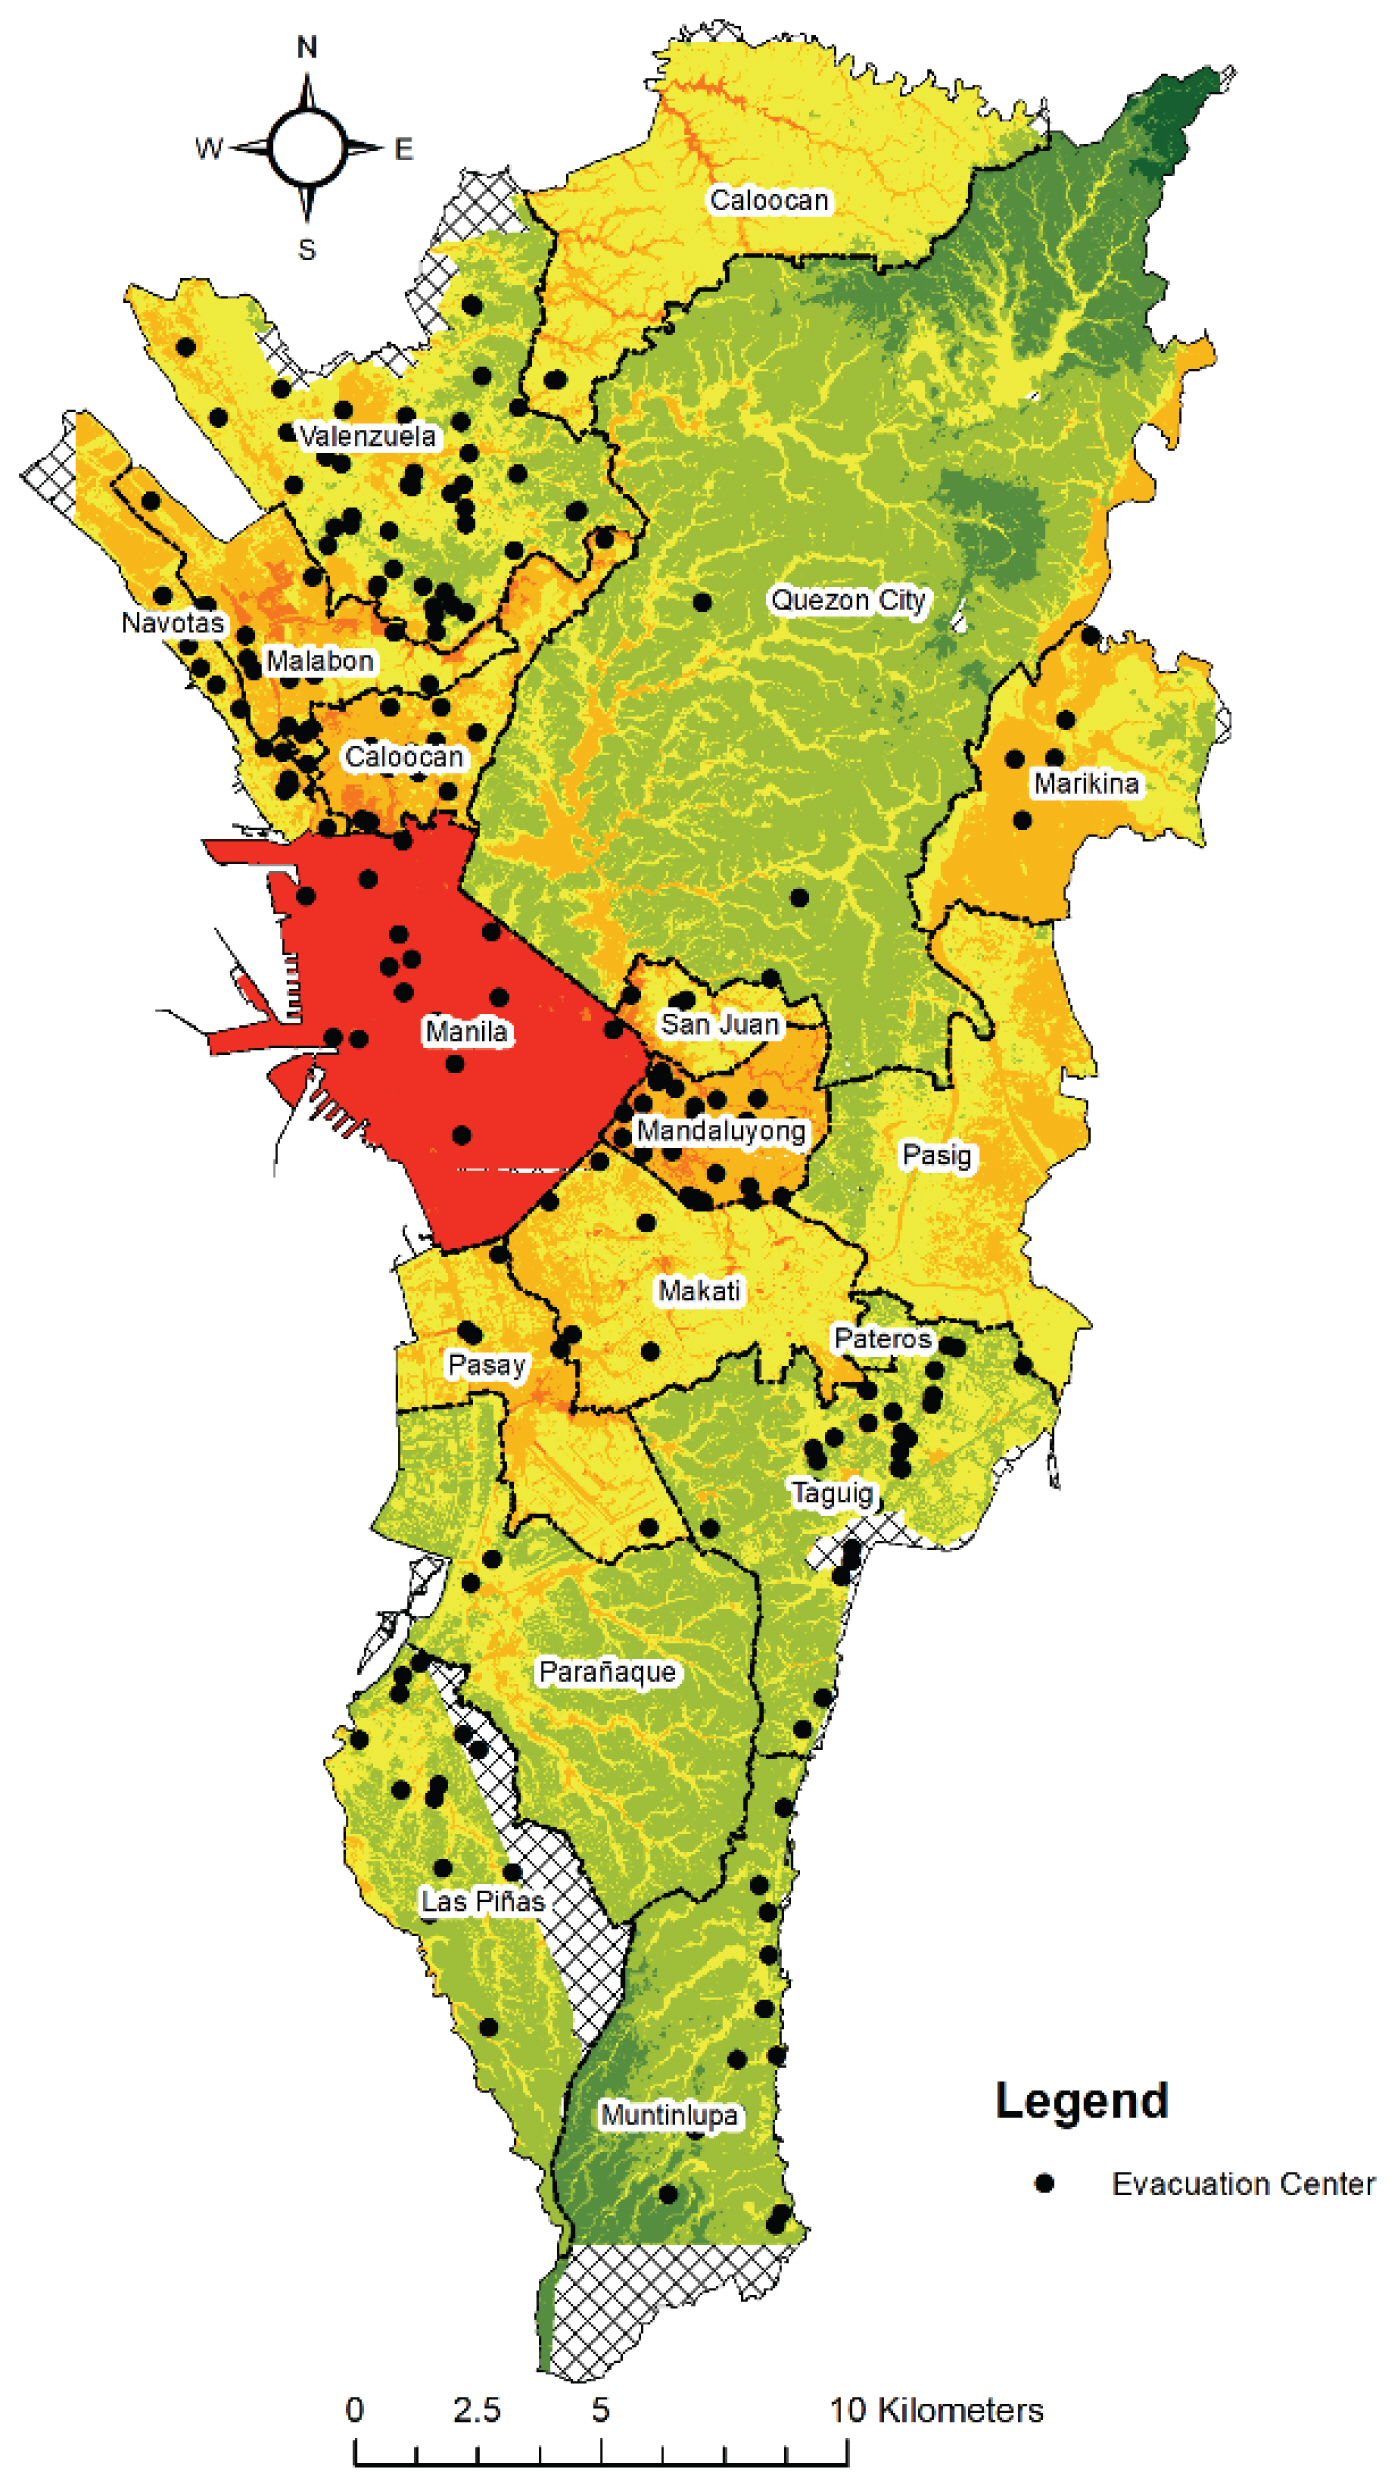
The City of Manila is the only local government unit classified under very high risk. High risk was observed in small areas of Malabon, Caloocan, San Juan, Mandaluyong, Makati and Pasay. Areas with high elevation found in the tips of Quezon City and Muntinlupa were found to have very low risk. Two-hundred two pre-determined Evacuation Centers from the Disaster Response Operations Monitoring and Information Center (DROMIC) was plotted on the developed flood risk map as shown in Fig. 3.
As seen in Table 6, the most number of evacuation centers were found at Valenzuela where flood risk ranges from moderately low risk to moderately high risk. Only two evacuation centers were declared within Quezon City where flood risk ranges from very low risk to moderately high risk. Three evacuation centers were declared at Pasay where risk is from moderate risk to high risk. Moreover, there were no evacuation centers declared in Pasig and Pateros. For the City of Manila where high risk to very high risk is observed, there were 14 evacuation centers. This practical application of the flood risk map is a very useful approach in achieving less damages and casualties during flood disasters. However, detailed information regarding the declared evacuation centers such as number of rooms, number of bathrooms/toilets, and capacity (in terms of population) could be of good use in the operation and management of response during the event of flood disaster.
4. CONCLUSION
In this study, AHP was used as the multi-criteria decision technique to calculate the weight for each of the fourteen indicators. The calculated weights were used to spatially map the flood risk index using overlay function in GIS. The resulting flood risk map from this study has identified the intensity of flood risk in the seventeen local government units of Metro Manila. Only the City of Manila was identified to have very high risk. High risk was observed in small areas of Malabon, Caloocan, San Juan, Mandaluyong, Makati and Pasay. Areas with high elevation found in the tips of Quezon City and Muntinlupa were found to have very low risk. By carefully analyzing the hazard, exposure, vulnerability and coping capacity, appropriate countermeasures can be identified. For example, for the City of Manila the resulting very high risk index is mainly due to its high exposure and vulnerability although it has moderate coping capacity. Therefore, concerned government agencies and stakeholders could properly plan for the most appropriate flood disaster countermeasure such as providing sufficient and reliable evacuation centers to temporarily lessen the exposure of the residents in Manila. Also, there is a need to provide detailed information about the existing evacuation centers such as number of rooms, number of bathroom/toilets and most importantly its capacity (in terms of population). These information are very relevant when it comes to the management and operation of the existing evacuation centers.