


1. м„ң лЎ
м „ м„ёкі„м ҒмңјлЎң кё°нӣ„ліҖнҷ”к°Җ мҙҲлһҳн•ң кё°мғҒмқҙліҖмңјлЎң мқён•ҙ нғңн’Қ, нҷҚмҲҳ л“ұкіј к°ҷмқҖ мһҗм—°мһ¬н•ҙмқҳ л№ҲлҸ„ л°Ҹ к°•лҸ„к°Җ мҰқк°Җн•ҳкі мһҲмңјл©° мқҙм—җ л”°лҘё мһҗм—°мһ¬н•ҙмқҳ н”јн•ҙлҸ„ мҰқк°Җн•ҳкі мһҲлҠ” 추세мқҙлӢӨ(Kim et al., 2017). көӯлӮҙмқҳ кІҪмҡ°лҸ„ м„ёкі„м Ғмқё 추세мҷҖ л§һл¬јл Ө м§ҖлҰ¬м ҒвӢ…кё°нӣ„м Ғ нҠ№м„ұмңјлЎң мқён•ҙ нғңн’Қ, нҷҚмҲҳ, мһҘл§Ҳ л“ұмқҳ мһҗм—°мһ¬н•ҙ н”јн•ҙмқҳ к·ңлӘЁк°Җ мҰқк°Җн•ҳкі мһҲлӢӨ.
2010л…„ 1мӣ” м„ңмҡём—җм„ң 73л…„ л§Ңм—җ кё°лЎқм Ғмқё к°•м„ӨлЎң мқён•ҙ л§Өмҡ° мӢ¬к°Ғн•ң н”јн•ҙк°Җ л°ңмғқн•ҳмҳҖмңјл©° мөңк·јмқё 2017л…„м—җ мІӯмЈјлҘј 비лЎҜн•ң мӨ‘л¶ҖлӮҙлҘҷ м§Җм—ӯм—җм„ң л°ңмғқн•ң кё°лЎқм Ғмқё нҸӯмҡ°лЎң мқён•ҳм—¬ м•Ҫ 547м–ө мӣҗмқҳ мһ¬мӮ°н”јн•ҙмҷҖ 2,539лӘ…мқҳ мқёлӘ…н”јн•ҙмҷҖ н•Ёк»ҳ лҸ„лЎң, лҶҚкІҪм§Җ, кұҙл¬ј м№ЁмҲҳ л“ұмқҳ л¬јм Ғ н”јн•ҙк°Җ л°ңмғқн•ҳмҳҖлӢӨ(Bai, 2014; Song et al., 2016). л”°лқјм„ң мһ¬н•ҙмқҳ л°ңмғқ к°ҖлҠҘм„ұкіј л°ңмғқ мң„м№ҳ, л°ңмғқ мӢңкё° л“ұмқ„ мҳҲмёЎн•ҳкё° мң„н•ң м—°кө¬к°Җ м§ҖмҶҚм ҒмңјлЎң мқҙлӨ„м§Җкі мһҲмңјл©°, мөңк·ј кө¬кёҖ(Google)м—җм„ң м ңм•Ҳн•ң нҷҚмҲҳ мҳҲмёЎ кҙҖл Ё AI кё°л°ҳ м•Ңкі лҰ¬мҰҳ м •нҷ•лҸ„к°Җ 90% мҲҳмӨҖм—җ лҸ„лӢ¬н–Ҳмқ„ м •лҸ„лЎң, лЁём§Җм•ҠмқҖ лҜёлһҳм—җ ліҙлӢӨ м •нҷ•н•ҳкІҢ мһҗм—°мһ¬н•ҙлҘј мҳҲмёЎн• мҲҳ мһҲмқ„ кІғмңјлЎң мҳҲмғҒлҗңлӢӨ.
к·ёлҹ¬лӮҳ мһҗм—°мһ¬н•ҙ л°ңмғқмқҙ мҳҲмёЎ м •нҷ•лҸ„к°Җ лҶ’아진лӢӨ н•ҙлҸ„ мһ¬н•ҙ л°ңмғқ л°Ҹ мқҙлЎң мқён•ң мһ¬мӮ°кіј мқёлӘ… л“ұмқҳ н”јн•ҙлҘј мҷ„лІҪнһҲ нҶөм ңн•ҳкё°лҠ” л¶Ҳк°ҖлҠҘн•ҳлӢӨ. мқҙм—җ м Ғм Ҳн•ң лҢҖмқ‘кіј н”јн•ҙ мөңмҶҢнҷ”лҘј мң„н•ҙ, л°°мҲҳнҺҢн”„, м ңл°© м„Өм№ҳ л“ұкіј к°ҷмқҖ кө¬мЎ°м Ғ лҢҖмұ…кіј мһ¬н•ҙ мҳҲвӢ…кІҪліҙ, нҶ м§Җмқҙмҡ©кі„нҡҚ, лҢҖн”јкі„нҡҚ мҲҳлҰҪ л“ұкіј к°ҷмқҖ 비кө¬мЎ°м Ғ лҢҖмұ…мқҳ мҲҳлҰҪмқҙ н•„мҲҳм ҒмқҙлӢӨ. к·ёлҹ¬лӮҳ нҳ„мһ¬ мһ¬н•ҙ л°©м§ҖлҘј мң„н•ң лӢӨм–‘н•ң л¬јлҰ¬м ҒвӢ…кө¬мЎ°м Ғ лҢҖмұ…мқҖ нҷҳкІҪлӢЁмІҙмҷҖ мЈјлҜјл“Өмқҳ л°ҳлҢҖм—җ л¶Җл”ӘнҳҖ л§ҺмқҖ м–ҙл ӨмӣҖмқ„ кІӘмқ„ лҝҗл§Ң м•„лӢҲлқј, кё°нӣ„ліҖнҷ”мҷҖ лҸ„мӢңнҷ”м—җ л”°лҘё мһҗм—°мһ¬н•ҙмқҳ к·ңлӘЁмҷҖ к°•лҸ„ мғҒмҠ№мңјлЎң мқён•ҙ кө¬мЎ°м Ғ лҢҖмұ…мқҳ н•ңкі„м җмқҙл“ңлҹ¬лӮҳкі мһҲлӢӨ(Kim et al., 2007).
мқҙм—җ 비кө¬мЎ°м Ғ лҢҖмұ…м—җ кҙҖн•ң кҙҖмӢ¬кіј н•„мҡ”м„ұмқҙ лҶ’м•„м§Җкі мһҲмңјл©°, 비кө¬мЎ°м Ғ лҢҖмұ…мқ„ л§Ҳл Ён•ҳкё° мң„н•ң мҲҳлӢЁмңјлЎң мЈјлЎң мһҗм—°мһ¬н•ҙ н”јн•ҙл°ңмғқмқҳ мҳҒн–ҘмқёмһҗлҘј мӮҙнҺҙліҙкі мһҗ лӢӨм–‘н•ң нҶөкі„лӘЁнҳ•м—°кө¬к°Җ мӢңлҸ„лҗҳм—ҲлӢӨ. мҳҲлҘј л“Өм–ҙ, нҡҢк·ҖлӘЁнҳ•мқ„ мқҙмҡ©н•ҳм—¬ к°•мҡ°лҹүм—җ мҳҒн–Ҙмқ„ мЈјлҠ” мқёмһҗлҘј нҷ•мқён•ҳлҠ” м—°кө¬мҷҖ н•Ёк»ҳ, мһ¬н•ҙк°Җ лҶҚ축мӮ° мӢңм„Өм—җ мЈјлҠ” мҳҒн–Ҙ л°Ҹ мһ¬н•ҙ н”јн•ҙм•Ўмқҳ кІ°м •мҡ”мқёмқ„ 분м„қн•ң м—°кө¬ л“ұ мң мӮ¬ м—°кө¬ л“ұмқҙ мһҲлӢӨ(Davis and Skaggs, 1992; Lee et al., 2016; Kim et al., 2018).
мһ¬н•ҙм—°ліҙмқҳ мӢңм„Өлі„ н”јн•ҙнҳ„нҷ©м—җ л”°лҘҙл©ҙ м§ҖлӮң 10л…„к°„(2008л…„~2017л…„) мһҗм—°мһ¬н•ҙлЎң мқён•ң м „мІҙ мһ¬мӮ°н”јн•ҙм•Ў 3мЎ° 5,324м–ө мӨ‘ кұҙл¬јн”јн•ҙм•ЎмқҖ 1,729м–ө мӣҗмңјлЎң м „мІҙмқҳ 4.9% м •лҸ„лҘј м°Ём§Җн•ҳкі мһҲлӢӨ. н•ңнҺё кұҙл¬ј н”јн•ҙм•ЎмқҖ мһ¬н•ҙк°Җ л°ңмғқн•ҳмҳҖмқҢм—җлҸ„ кұҙл¬јн”јн•ҙк°Җ л°ңмғқн•ҳм§Җ м•Ҡм•„ кұҙл¬јн”јн•ҙм•Ўмқҙ 0мңјлЎң 집계лҗҳлҠ” мқҙмӮ°нҳ• ліҖмҲҳмҷҖ кұҙл¬јн”јн•ҙк°Җ л°ңмғқн• кІҪмҡ°мқҳ м—°мҶҚнҳ• ліҖмҲҳк°Җ нҳјн•©лҗҳм–ҙмһҲлҠ” нҠ№м„ұмқ„ м§ҖлӢҲкё°м—җ, л‘җ нҠ№м„ұмқ„ лӘЁл‘җ л°ҳмҳҒн• мҲҳ мһҲлҠ” нҶөкі„лӘЁнҳ•мқҙ н•„мҡ”н•ҳлӢӨ. нҠ№нһҲ 0мқҳ к°’мқҙ кіјлҸ„н•ҳкІҢ нҸ¬н•Ёлҗң мҳҒкіјмһү мһҗлЈҢмқҳ нҠ№м§•мқ„ м Ғм ҲнһҲ л°ҳмҳҒн• мҲҳ мһҲлҠ” мҳҒкіјмһү лӘЁнҳ•мқҙ кі л Өлҗҳм–ҙм•ј н•ңлӢӨ.
кё°мЎҙмқҳ лҢҖл¶Җ분 мҳҒкіјмһү мһҗлЈҢ кҙҖл Ё м—°кө¬л“ӨмқҖ нҸ¬м•„мҶЎ 분нҸ¬ кё°л°ҳмқҳ лӘЁнҳ•мңјлЎң мҳҒкіјмһү мһҗлЈҢлҘј мў…мҶҚліҖмҲҳлЎң мӮ¬мҡ©н•ң м„ н–үм—°кө¬мқҳ кІҪмҡ° мЈјлЎң мҳҒкіјмһү лӘЁнҳ•кіј нҸ¬м•„мҶЎ лӘЁнҳ•мқ„ кІ°н•©н•ң мҳҒкіјмһү нҸ¬м•„мҶЎ лӘЁнҳ• лҳҗлҠ” мқҢмқҙн•ӯ лӘЁнҳ•мқ„ кІ°н•©н•ң мҳҒкіјмһү мқҢмқҙн•ӯ лӘЁнҳ•мқ„ нҶөн•ҙ мһҗлЈҢлҘј 분м„қн•ҳмҳҖлӢӨ(Kim and Lee, 2008; Chun, 2017). Hwang et al. (2016)мқҳ м—°кө¬лҠ” м •м§Җк¶ӨлҸ„ ліөн•©мң„м„ұмқҳ кё°мғҒнғ‘мһ¬мІҙмқҳ м Ғмҷём„ мұ„л„җлЎңл¶Җн„° м–»м–ҙ진 л°қкё°мҳЁлҸ„мҷҖ лҢҖлҘҳм§ҖмҲҳк°Җ к°•мҡ°к°•лҸ„мҷҖ м–ҙл– н•ң м—°кҙҖм„ұмқ„ к°–лҠ”м§Җ м•Ңм•„ліҙкё° мң„н•ҙ ліөн•©нҸ¬м•„мҶЎ 분нҸ¬м—җ кё°л°ҳн•ң нҡҢк·ҖлӘЁнҳ•мқ„ м ңм•Ҳн•ҳмҳҖмңјл©°, Kim et al. (2014)мқҳ м—°кө¬м—җм„ңлҠ” м„ңмҡёмӢң м№ЁмҲҳм Җк°җлҢҖмұ…мқ„ мҲҳлҰҪн•ҳкё° мң„н•ҙ ліөн•©нҸ¬м•„мҶЎ кё°л°ҳ лӘЁнҳ•мқ„ нҷңмҡ©н•ҳмҳҖлӢӨ. лҳҗн•ң, Parveen et al. (2016)мқҳ м—°кө¬лҠ” 0мқҳ к°’кіј м–‘мҲҳк°’мқҙ нҳјмһ¬лҗң м§Ғм—…нӣҲл Ёл№„мҡ© мһҗлЈҢмқҳ 분м„қм—җ ліөн•©нҸ¬м•„мҶЎ лӘЁнҳ•мқ„ нҷңмҡ©н•ҳм—¬ ліөн•©нҸ¬м•„мҶЎ лӘЁнҳ•мқҳ нҷңмҡ©м„ұмқ„ нҷ•мқён•ҳмҳҖлӢӨ. н•ңнҺё мҳҒкіјмһү нҠ№м„ұмқ„ л°ҳмҳҒн•ң мҳҒкіјмһү ліөн•©нҸ¬м•„мҶЎ лӘЁнҳ•мқ„ нҷңмҡ©н•ң к·ё мӮ¬лЎҖлҘј м°ҫкё°к°Җ нһҳл“ӨлӢӨ.
л”°лқјм„ң ліё м—°кө¬м—җм„ңлҠ” мҳҒкіјмһүмқҳ мһҗлЈҢ нҠ№м„ұмқ„ л°ҳмҳҒн•ң кұҙл¬јн”јн•ҙм•Ў мһҗлЈҢлҘј кё°л°ҳмңјлЎң мһ¬н•ҙл°ңмғқм§Җм—ӯ, мһ¬н•ҙл°ңмғқкё°к°„, мһ¬н•ҙмў…лҘҳ ліҖмҲҳлҘј нҷңмҡ©н•ҳм—¬ ліөн•©нҸ¬м•„мҶЎ лӘЁнҳ•кіј мҳҒкіјмһү ліөн•©нҸ¬м•„мҶЎ лӘЁнҳ•мқ„ м Ғмҡ© нӣ„ 비көҗ분м„қмқ„ нҶөн•ҙ лҚ” лҶ’мқҖ нҷңмҡ©м„ұмқ„ к°Җ진 лӘЁнҳ•мқ„ м¶”м •н•ЁмңјлЎңмҚЁ мһ¬н•ҙм Җк°җлҢҖмұ…м—җ лҸ„мӣҖмқҙ лҗ мҲҳ мһҲлҠ” м„ӨлӘ…л Ҙ лҶ’мқҖ нҶөкі„лӘЁнҳ•мқ„ м ңмӢңн•ҳкі мһҗ н•ңлӢӨ.
2. м—°кө¬л°©лІ•
2.1 ліөн•©нҸ¬м•„мҶЎ лӘЁнҳ•
ліҖмҲҳ к°„мқҳ кҙҖкі„лҘј м•Ңм•„ліҙлҠ” нҶөкі„м Ғ л°©лІ•мңјлЎң мқјл°ҳ м„ нҳ• лӘЁнҳ•(Generalized linear model, GLM)мқ„ 비лЎҜн•ҳм—¬ м—¬лҹ¬ лӘЁнҳ•мқҙ л„җлҰ¬ мӮ¬мҡ©лҗҳкі мһҲлӢӨ. мҳҲлҘј л“Өм–ҙ, мһ¬н•ҙ 분야м—җм„ң мһҗм—°мһ¬н•ҙк°Җ мқјм–ҙлӮң нҡҹмҲҳлҘј мў…мҶҚліҖмҲҳлЎң н• л•ҢлҠ” м—°кІ°н•ЁмҲҳ(link function)лҘј лЎңк·ё(log)лЎң м·Ён•ҳлҠ” нҸ¬м•„мҶЎ м„ нҳ•нҡҢк·Җ лӘЁнҳ•мқ„ кё°л°ҳмңјлЎң н•ңлӢӨ. н•ҳм§Җл§Ң мӮ¬кұҙмқҳ нҡҹмҲҳк°Җ м•„лӢҢ к°Ғ мӮ¬кұҙм—җ л”°лҘё м–ҙл– н•ң м–‘мқҳ мӢӨмҲ«к°’мқ„ мў…мҶҚліҖмҲҳлЎң н• л•ҢлҠ” нҸ¬м•„мҶЎ нҡҢк·ҖлӘЁнҳ•мқ„ мқҙмҡ©н•ҳкё°м—җлҠ” м Ғм Ҳн•ҳм§Җк°Җ м•ҠлӢӨ. мқҙмІҳлҹј, 분야별 ліҖмҲҳк°Җ к°Җм§ҖлҠ” нҠ№лі„н•ң м„ұм§ҲлЎң мқён•ҙ лӘЁнҳ•мқҳ м Ғн•©лҸ„к°Җ нҳ„м Җн•ҳкІҢ лӮ®м•„м§Җкұ°лӮҳ лӘЁнҳ•мқ„ м Ғн•© мӢңнӮӨм§Җ лӘ»н•ҳлҠ” кІҪмҡ°лҘј мў…мў… кІӘлҠ”лӢӨ(Smyth, 1989).
мў…мҶҚліҖмҲҳк°Җ м–‘мқҳ к°’мқ„ к°Җм§ҖлҠ” мӢӨмҲҳмқҙкі м…Җ мҲҳ мһҲлҠ” мӮ¬кұҙмқҙ л°ңмғқн•Ём—җ л”°лқј мў…мҶҚліҖмҲҳк°Җ м–»м–ҙм§ҖлҠ” кІҪмҡ°м—җ ліөн•©нҸ¬м•„мҶЎ 분нҸ¬(Compound Poisson distribution)лҘј л”°лҘҙлҠ”лҚ°, мң„мқҳ кІҪмҡ°лҘј мҳҲлҘј л“Өл©ҙ, кұҙл¬јн”јн•ҙлҠ” мһҗм—°мһ¬н•ҙлЎң кұҙл¬јм—җ н”јн•ҙк°Җ мқјм–ҙлӮ¬мқ„ л•Ң м–»мқ„ мҲҳ мһҲлҠ” к°’мқҙл©° н•ӯмғҒ 0 мқҙмғҒмқҳ мӢӨмҲҳмқҳ к°’мқ„ к°Җм§Җкё° л•Ңл¬ём—җ ліөн•©нҸ¬м•„мҶЎ 분нҸ¬лҘј мқҙмҡ©н•ң лӘЁнҳ•мқ„ мӮ¬мҡ©н•ҳлҠ” кІғмқҙ м Ғм Ҳн• кІғмқҙлӢӨ. мӢӨм ңлЎң мҲңліҙн—ҳлЈҢ, к°•мҡ°лҹү, көҗнҶөмӮ¬кі м—җ л”°лҘё н”јн•ҙм•Ў л“ұмқ„ мў…мҶҚліҖмҲҳлЎң к°Җм§ҖлҠ” кІҪмҡ° ліөн•©нҸ¬м•„мҶЎ 분нҸ¬лҘј мқҙмҡ©н•ң лӘЁнҳ•мқ„ мӢӨм ң мқ‘мҡ©м—°кө¬м—җм„ң л§Һмқҙ мӮ¬мҡ©н•ҳкі мһҲлӢӨ(JГёrgensen and Paes de Souza, 1994).
лЁјм Җ ліөн•©нҸ¬м•„мҶЎ лӘЁнҳ•мқ„ нҸ¬н•Ён•ҳкі мһҲлҠ” м§ҖмҲҳмӮ°нҸ¬лӘЁнҳ•(Exponential dispersion model)м—җ лҢҖн•ҙ к°„лһөн•ң м„ӨлӘ…мқҖ лӢӨмқҢкіј к°ҷлӢӨ. м§ҖмҲҳмӮ°нҸ¬лӘЁнҳ•мқҖ Tweedie (1984)м—җ мІҳмқҢмңјлЎң м ңм•Ҳлҗҳм–ҙ Tweedie лӘЁнҳ•мңјлЎң л¶ҲлҰ¬кё°лҸ„ н•ңлӢӨ.
JГёrgensen (1987)м—җ мқҳн•ҙ м—°кө¬лҗң м§ҖмҲҳмӮ°нҸ¬лҘј мқҙмҡ©н•ң лӘЁнҳ•мқҖ м—¬лҹ¬ к°Җм§Җ нҶөкі„м Ғ 분м„қм—җ л§Һмқҙ м“°мқҙлҠ” лӘЁнҳ•мңјлЎң мқјл°ҳм Ғмқё м§ҖмҲҳмӮ°нҸ¬ 분нҸ¬мқҳ нҷ•лҘ л°ҖлҸ„н•ЁмҲҳлҠ” Eq. (1)кіј к°ҷлӢӨ.
м—¬кё°м„ң ОұлҠ” мғҒмҲҳн•ЁмҲҳмқҙл©° ОәлҠ” лҲ„мңЁмғқм„ұн•ЁмҲҳ(cumulant generating function)мқҙл©°, Оё, П•лҠ” лӘЁмҲҳмқҙлӢӨ. нҠ№нһҲ, П•лҠ” 0 мқҙмғҒмқҳ к°’мқ„ к°Җм§ҖлҠ” мӮ°нҸ¬лӘЁмҲҳ(dispersion parameter)мқҙлӢӨ(JГёrgensen, 1987).
Tweedie 분нҸ¬лҠ” лҲ„мңЁмғқм„ұн•ЁмҲҳмқҳ кі мң н•ң м„ұм§Ҳмқ„ мқҙмҡ©н•ҳм—¬ кё°лҢ“к°’кіј 분мӮ°мқё E(y)= ОәвҖІ(Оё)мҷҖ Var(y)= П• ОәвҖі (Оё)лҘј мүҪкІҢ кө¬н• мҲҳ мһҲмңјл©°, ОёмҷҖ ОјлҠ” мқјлҢҖмқј н•ЁмҲҳмһ„мқ„ нҶөн•ҳм—¬ ОәвҖі (Оё)лҘј Ојмқҳ н•ЁмҲҳ V(Ој)лЎң н‘ңнҳ„н• мҲҳ мһҲкі мқҙлҘј л©ұ분мӮ°н•ЁмҲҳ(power variance function)мқҙлқјкі лӘ…лӘ…н•ңлӢӨ(Barndorff-Nielsen, 1978; Kaas, 2005).
л©ұ분мӮ°н•ЁмҲҳмқҳ мқјл°ҳм Ғмқё нҳ•нғңлҠ” V (Ој)= ОјpлЎң лӮҳнғҖлӮҙл©°, мқҙл•Ң 분мӮ°н•ЁмҲҳмқҳ pлҠ” м§ҖмӢңлӘЁмҲҳ(index parameter)мқҙлӢӨ. м§ҖмҲҳмӮ°нҸ¬ лӘЁнҳ•м—җм„ң л©ұ분мӮ°н•ЁмҲҳлҠ” мӨ‘мҡ”н•ң м„ұм§Ҳмқ„ к°Җм§ҖлҠ”лҚ°, л©ұ분мӮ°н•ЁмҲҳмқҳ нҳ•нғңл§Ң кІ°м •лҗңлӢӨл©ҙ м§ҖмҲҳмӮ°нҸ¬ лӘЁнҳ•мқҳ нҷ•лҘ 분нҸ¬лҘј м•Ң мҲҳ мһҲлӢӨ(JГёrgensen, 1997).
Tweedie 분нҸ¬лҠ” м§ҖмӢңлӘЁмҲҳмқҳ нҳ•нғңм—җ л”°лқј 분нҸ¬к°Җ лӢ¬лқјм§ҖлҠ” мһҘм җмқҙ мһҲлӢӨ. м§ҖмӢңлӘЁмҲҳк°Җ 0 < p < 1мқё кІҪмҡ°м—җлҠ” нҷ•лҘ 분нҸ¬к°Җ мЎҙмһ¬н•ҳм§Җ м•Ҡмңјл©°, p = 0мқё кІҪмҡ°м—җлҠ” м •к·ң분нҸ¬лҘј л”°лҘҙкі , p = 1мқј л•ҢлҠ” нҸ¬м•„мҶЎ 분нҸ¬, p = 2мқј л•ҢлҠ” к°җл§Ҳ분нҸ¬лҘј л”°лҘёлӢӨкі м•Ңл Өм ё мһҲлӢӨ. нҠ№нһҲ, 1 < p < 2мқј л•ҢлҠ” ліөн•©нҸ¬м•„мҶЎ 분нҸ¬лҘј л”°лҘҙл©°, ліөн•©нҸ¬м•„мҶЎ 분нҸ¬лҠ” 0м—җм„ң м–‘мқҳ нҷ•лҘ мқ„(нҷ•лҘ м§Ҳлҹүн•ЁмҲҳ) к°Җм§ҖлҠ” мқҙмӮ°нҳ• ліҖмҲҳмҷҖ 0 мқҙмғҒ м–‘мқҳ мӢӨмҲ«к°’м—җм„ңлҠ” нҷ•лҘ л°ҖлҸ„н•ЁмҲҳлҘј к°Җм§ҖлҠ” м—°мҶҚнҳ• ліҖмҲҳк°Җ кІ°н•©н•ң 분нҸ¬лЎң м•Ңл Өм ё мһҲлӢӨ.
к·ёлҹ¬лӮҳ м§ҖмӢңлӘЁмҲҳ pлҘј м¶”м •н•ҳлҠ” лҚ° мһҲм–ҙм„ң ліөн•©нҸ¬м•„мҶЎ 분нҸ¬мқҳ нҷ•лҘ л°ҖлҸ„н•ЁмҲҳмқҳ нҠ№м„ұмғҒ кі„мӮ°мқҳ м–ҙл ӨмӣҖмңјлЎң мқён•ҙ лӢӨм–‘н•ң лӘЁмҲҳ м¶”м • л°©лІ•л“Өмқҙ м ңм•Ҳлҗҳм—ҲлӢӨ. Cox and Reid (1987)мқҖ н”„лЎңнҢҢмқј к°ҖлҠҘлҸ„(profile likelihood)л°©лІ•мқ„ м ңм•Ҳн•ҳм—¬ pлҘј м¶”м •н•ҳмҳҖмңјл©°, Nelder and Pregibon (1987)мқҖ нҷ•мһҘлҗң мӨҖмҡ°лҸ„(extended quasi-likelihood) л°©лІ•мқ„ кё°л°ҳмңјлЎң н•ң л°©лІ•мқ„ м ңм•Ҳн•ҳмҳҖлӢӨ. мөңк·ј м—°кө¬м—җм„ңлҠ” м»ҙн“ЁнҢ…мқҳ л°ңм „мқ„ нҶөн•ҙ лҚ”мҡұ м •нҷ•н•ң ліөн•©нҸ¬м•„мҶЎ 분нҸ¬лҘј кө¬н• мҲҳ мһҲлӢӨ(Dunn and Smyth, 2005, 2008).
ліөн•©нҸ¬м•„мҶЎ лӘЁнҳ•мқ„ м Ғмҡ©н•ҳкё° мң„н•ҙ ліё м—°кө¬мқҳ кҙҖмӢ¬ліҖмҲҳмқё кұҙл¬јн”јн•ҙм•Ўм—җ лҢҖн•ҙ лӘЁнҳ•мӢқмқ„ м Ғмҡ©н•ҳл©ҙ лӢӨмқҢкіј к°ҷлӢӨ. мЈјм–ҙ진 кё°к°„м—җ лҢҖн•ҙм„ң нҷ•лҘ ліҖмҲҳ Nмқ„ мһҗм—°мһ¬н•ҙк°Җ мқјм–ҙлӮң нҡҹмҲҳлЎң м •мқҳн•ңлӢӨ. лҳҗн•ң XiлҘј iлІҲм§ё мһҗм—°мһ¬н•ҙк°Җ л°ңмғқн–Ҳмқ„ л•Ңмқҳ кұҙл¬јн”јн•ҙм•ЎмңјлЎң м •мқҳн•ҳл©°, мқҙлҹ¬н•ң нҷ•лҘ ліҖмҲҳл“Өмқҳ к°Җм •мқҖ лӢӨмқҢмқҳ Eq. (2)мҷҖ к°ҷлӢӨ.
м—¬кё°м„ң нҷ•лҘ ліҖмҲҳ NмқҖ нҸүк· мқҙ О»мқё нҸ¬м•„мҶЎ 분нҸ¬(Pois)лҘј л”°лҘҙл©°, нҷ•лҘ ліҖмҲҳ XiлҠ” к°җл§Ҳ분нҸ¬(О“)лҘј л”°лҘҙкі , N, X1, X2, вӢҜ,XNмқҖ м„ңлЎң лҸ…лҰҪмһ„мқ„ к°Җм •н•ңлӢӨ. мқҙм ң нҷ•лҘ ліҖмҲҳ YлҘј мЈјм–ҙ진 кё°к°„м—җ лҢҖн•ң лҲ„м Ғ кұҙл¬јн”јн•ҙм•ЎмңјлЎң м •мқҳн•ҳл©ҙ лӢӨмқҢмқҳ Eq. (3)кіј к°ҷлӢӨ.
мқҙл•Ң нҷ•лҘ ліҖмҲҳ YлҘј нҸүк· мқҙ О»мқё ліөн•©нҸ¬м•„мҶЎ 분нҸ¬лҘј л”°лҘёлӢӨкі н•ңлӢӨ. мҰү, кұҙл¬јн”јн•ҙм•Ў YлҠ” Xiл“Өмқҳ мһ„мқҳ лҲ„м Ғн•©(random sum)мңјлЎң м •мқҳлҗҳл©°, мқҙл•Ң N= 0мқё кІҪмҡ°м—җлҠ” Yмқҳ к°’лҸ„ 0мңјлЎң м •мқҳн•ңлӢӨ.
Eq. (4)мқҳ кҙҖкі„мӢқмқ„ нҶөн•ҙ кұҙл¬јн”јн•ҙм•Ў Yмқҳ нҸүк· Ој= О»ОұОі, 분мӮ° П•Ојp= О»Оұ(Оұ + 1)Оі2мқ„ м–»мқ„ мҲҳ мһҲлӢӨ.
ліөн•©нҸ¬м•„мҶЎ 분нҸ¬лҘј л”°лҘҙлҠ” нҷ•лҘ ліҖмҲҳ YлҠ” Tweedie 분нҸ¬м—җм„ң м–ёкёүн•ң л°”мҷҖ к°ҷмқҙ мқҙмӮ°нҳ•кіј м—°мҶҚнҳ•мқҙ нҳјн•©лҗң 분нҸ¬мқҙлҜҖлЎң нҷ•лҘ л°ҖлҸ„н•ЁмҲҳлҘј лӢӨмқҢмқҳ Eq. (5)мҷҖ к°ҷмқҙ н‘ңнҳ„н• мҲҳ мһҲлӢӨ.
2.2 мҳҒкіјмһү ліөн•©нҸ¬м•„мҶЎ лӘЁнҳ•
м „мҲ н•ң ліөн•©нҸ¬м•„мҶЎ лӘЁнҳ•(Compound Poisson Model)мқҖ мһҗлЈҢк°Җ мҳҒ(zero)мқ„ кіјлҸ„н•ҳкІҢ нҸ¬н•Ён•ҳкі мһҲлҠ” мҳҒкіјмһү мһҗлЈҢмқј л•Ң мһҗлЈҢмқҳ м„ұкІ©мғҒ к·ё 분нҸ¬лҘј л”°лҘҙм§Җ лӘ»н• л•Ңк°Җ мһҲм–ҙ 분м„қм—җ м–ҙл ӨмӣҖмқҙ мһҲлӢӨ. мқҙлҹ¬н•ң лӢЁм җмқ„ ліҙмҷ„н•ҳкё° мң„н•ҳм—¬ 분нҸ¬мқҳ нҳјн•© нҳ•нғңлҘј к°Җм§ҖлҠ” мҳҒкіјмһү лӘЁнҳ•мқҙ м ңм•Ҳлҗҳм—Ҳмңјл©° ліё л…јл¬ём—җм„ңлҠ” ліөн•©нҸ¬м•„мҶЎ лӘЁнҳ•кіј мҳҒкіјмһү лӘЁнҳ•мқ„ кІ°н•©н•ң мҳҒкіјмһү ліөн•©нҸ¬м•„мҶЎ лӘЁнҳ•(Zero Inflated Compound Poisson Model)мқ„ нҷңмҡ©н•ҳм—¬ 분м„қмқ„ мӢңн–үн•ҳмҳҖлӢӨ(Lambert, 1992). мҳҒкіјмһү ліөн•©нҸ¬м•„мҶЎ 분нҸ¬лҠ” м¶”м •лҗң м§ҖмӢңлӘЁмҲҳ pк°Җ 1 < p < 2мқј л•Ң ліөн•©нҸ¬м•„мҶЎ 분нҸ¬лҘј л”°лҘҙл©° мқҙмҷҖ лӢӨлҘё к°’мңјлЎң pк°Җ м¶”м •лҗң кІҪмҡ°м—җлҠ” лӢӨлҘё 분нҸ¬лҘј л”°лҘҙкё° л•Ңл¬ём—җ мҳҒкіјмһү ліөн•©нҸ¬м•„мҶЎ 분нҸ¬лҘј м Ғмҡ©н• мҲҳ м—ҶлӢӨ. мҳҒкіјмһү ліөн•©нҸ¬м•„мҶЎ 분нҸ¬лҠ” ліөн•©нҸ¬м•„мҶЎ 분нҸ¬мҷҖ лІ лҘҙлҲ„мқҙ 분нҸ¬мҷҖмқҳ нҳјн•©лӘЁнҳ•(mixed model)мңјлЎң нҷ•лҘ ліҖмҲҳ YлҠ” мҳҒл§Ң лӮҳнғҖлӮҳлҠ” мғҒнғңмқҳ нҷ•лҘ к°’мқҙ л”°лЎң м •н•ҙ진лӢӨ. м •мқҳн•ҳл©ҙ лӢӨмқҢмқҳ Eq. (6)кіј к°ҷлӢӨ.
Eq. (6)м—җм„ң CPoiлҠ” ліөн•©нҸ¬м•„мҶЎл¶„нҸ¬лҘј мқҳлҜён•ҳл©° Y=0мқҖ л‘җ к°Җм§Җ нҷ•лҘ м—җм„ң лӘЁл‘җ л°ңмғқн•ҳл©° нҷ•лҘ л°ҖлҸ„н•ЁмҲҳлҘј лӢӨмқҢ Eq. (7)кіј к°ҷмқҙ н‘ңнҳ„н• мҲҳ мһҲлӢӨ.
Eq. (7)м—җм„ңмқҳ fZICPM(y, n|О», Оұ, Оі)лҠ” мҳҒкіјмһүліөн•©нҸ¬м•„мҶЎлӘЁнҳ•мқ„ мқҳлҜён•ҳл©° fCPM(y, n|О», Оұ, Оі) лҠ” Eq. (5)мқҳ ліөн•©нҸ¬м•„мҶЎл¶„нҸ¬м—җм„ңмқҳ нҷ•лҘ л°ҖлҸ„н•ЁмҲҳмҷҖ к°ҷлӢӨ.
2.2.1 кұҙл¬јн”јн•ҙм•Ўмқҳ мҳҒкіјмһү ліөн•©нҸ¬м•„мҶЎ 분нҸ¬м Ғмҡ©
м•һ м Ҳм—җм„ң кұҙл¬јн”јн•ҙм•Ўкіј к°ҷмқҙ мқҙмӮ°нҳ• л°Ҹ м—°мҶҚнҳ• кө¬мЎ°к°Җ нҳјмһ¬лҗң мһҗлЈҢлҘј 분м„қн•ҳкё° мң„н•ҙ ліөн•©нҸ¬м•„мҶЎ лӘЁнҳ•мқ„ мӮ¬мҡ©н•ҳлҠ” кІғмқҙ м Ғм Ҳн•ҳлӢӨ. лҳҗн•ң мһҗлЈҢк°Җ мҳҒ(0)мқҳ к°’мқ„ кіјлҸ„н•ҳкІҢ нҸ¬н•Ён•ң кІҪмҡ° мҳҒкіјмһү ліөн•©нҸ¬м•„мҶЎ лӘЁнҳ•мқ„ м Ғмҡ©н•ҳлҠ” кІғмқҙ 분м„қм—җ м Ғм Ҳн•Ёмқ„ н•Ёк»ҳ м–ёкёүн•ҳмҳҖлӢӨ.
Table 1мқҖ ліё м—°кө¬м—җм„ң мў…мҶҚліҖмҲҳлЎң нҷңмҡ©н•ң 1994л…„л¶Җн„° 2015л…„к№Ңм§Җ мһҗм—°мһ¬н•ҙм—җ мқҳн•ң кұҙл¬јн”јн•ҙм•Ўмқҳ л№ҲлҸ„н‘ңмқҙлӢӨ. Table 1м—җм„ңмҷҖ к°ҷмқҙ мҙқ 9,341кұҙмқҳ мһҗм—°мһ¬н•ҙ мӨ‘ кұҙл¬јн”јн•ҙк°Җ л°ңмғқн•ҳм§Җ м•ҠмқҖ кІҪмҡ°лҠ” 4,799кұҙ(м•Ҫ 51.3%)мңјлЎң мһҗлЈҢмқҳ 50% мқҙмғҒмқҙ 0мқҳ к°’мқ„ к°Җм§ҖлҠ” мҳҒкіјмһү мһҗлЈҢмһ„мқ„ нҷ•мқён• мҲҳ мһҲлӢӨ.
л”°лқјм„ң ліөн•©нҸ¬м•„мҶЎ 분нҸ¬лҘј м Ғмҡ©н•ҳл©ҙ кұҙл¬јн”јн•ҙм•Ўмқҙ 0мқё кІҪмҡ° нҷ•лҘ мқ„ л¶Җм—¬н• мҲҳ мһҲлҠ” мқҙмӮ°нҳ• ліҖмҲҳмқҳ нҠ№м§•кіј кұҙл¬јн”јн•ҙм•Ўмқҳ к°’мқҙ 0мқҙ м•„лӢҢ м–‘мқҳ мӢӨмҲ«к°’мқ„ к°Җм§Ҳ л•Ңмқҳ м—°мҶҚнҳ• ліҖмҲҳмқҳ нҠ№м§•мқ„ лӘЁл‘җ м„ӨлӘ…н• мҲҳ мһҲлӢӨлҠ” мһҘм җмқ„ к°Җм§Җкі мһҲлӢӨ.
3. мһҗлЈҢ
3.1 мһҗлЈҢ м„ӨлӘ… л°Ҹ кё°мҙҲ분м„қ
ліё 분м„қм—җм„ң мӮ¬мҡ©лҗҳлҠ” мһҗлЈҢлҠ” мһ¬н•ҙм—°ліҙлҘј нҶөн•ҙ 1994л…„л¶Җн„° 2015л…„к№Ңм§Җ н•ңкөӯ м „ м§Җм—ӯм—җм„ң л°ңмғқн•ң мһҗм—°мһ¬н•ҙм—җ л”°лҘё кұҙл¬јн”јн•ҙм•Ўмқ„ мӨ‘мӢ¬мңјлЎң кө¬м¶•лҗҳм—ҲлӢӨ. мў…мҶҚліҖмҲҳлЎң мӮ¬мҡ©лҗ кұҙл¬јн”јн•ҙм•ЎмқҖ 1994л…„л¶Җн„° 2015л…„к№Ңм§Җмқҳ мһҗм—°мһ¬н•ҙлЎң мқён•ҙ л°ңмғқн•ң кұҙл¬јмҶҗмӢӨм—җ лҢҖн•ң көӯк°Җм§ҖмӣҗкёҲм•ЎмңјлЎңмҚЁ н–үм •м•Ҳм „л¶Җк°Җ мҲҳ집н•ң н”јн•ҙ м •лҸ„лҘј л°ҳмҳҒн•ҳм—¬ пҪўмһҗм—°мһ¬н•ҙ кө¬нҳё л°Ҹ ліөкө¬ 비мҡ© л¶ҖлӢҙкё°мӨҖ л“ұм—җ кҙҖн•ң к·ңм •пҪЈм—җ л”°лқј м§Җкёүлҗң кёҲм•Ўмқҳ н•©кі„мқҙлӢӨ. ліё м—°кө¬м—җм„ңлҠ” мқҙлҘј мў…мҶҚліҖмҲҳмқҳ лҚ°мқҙн„°лЎң мӮ¬мҡ©н•ҳмҳҖмңјл©° мқҙлҠ” көӯлӮҙм—җм„ң н”јн•ҙ к·ңлӘЁлҘј нҷ•мқён• мҲҳ мһҲлҠ” мң мқјн•ң кіөмӢқм Ғмқё нҶөкі„мһҗлЈҢмқҙлӢӨ.
лҸ…лҰҪліҖмҲҳлҠ” мһ¬н•ҙкё°к°„, мһ¬н•ҙм§Җм—ӯ к·ёлҰ¬кі мһ¬н•ҙмў…лҘҳмқҳ ліҖмҲҳлЎң кө¬м„ұлҗңлӢӨ. мқҙ ліҖмҲҳл“ӨмқҖ кұҙл¬јн”јн•ҙм•Ўкіј м§Ғм ‘м Ғмқё м—°кҙҖмқҙ мһҲлӢӨкі м—¬кІЁм§ҖлҠ” ліҖмҲҳл“Өмқҙл©° мһ¬н•ҙлі„ кұҙл¬јн”јн•ҙм•Ў м°Ёмқҙмқҳ мӣҗмқёмқ„ нҢҢм•…н•ҳкё° мң„н•ҳм—¬ м„ м •лҗҳм—ҲлӢӨ.
мІ« лІҲм§ёлЎң мһ¬н•ҙкё°к°„ ліҖмҲҳлҠ” мһҗм—°мһ¬н•ҙк°Җ л°ңмғқн•ң кё°к°„мңјлЎң 짧кІҢлҠ” н•ҳлЈЁм—җм„ң кёёкІҢлҠ” 22мқјк№Ңм§Җ м§ҖмҶҚлҗҳм—ҲлӢӨ. мһҗм—°мһ¬н•ҙлҠ” нҸүк· м ҒмңјлЎң 5.8мқј, м•Ҫ 6мқј лҸҷм•Ҳ м§ҖмҶҚлҗҳм—Ҳмңјл©° мһ¬н•ҙкё°к°„мқҙ кёём–ҙм§ҲмҲҳлЎқ кұҙл¬јн”јн•ҙм•Ўмқҙ мҰқк°Җн•ҳлҠ” м–‘мқҳ мғҒкҙҖкҙҖкі„к°Җ мЎҙмһ¬н• кІғмңјлЎң мҳҲмғҒн• мҲҳ мһҲлӢӨ. л‘җ лІҲм§ёлЎң мһ¬н•ҙм§Җм—ӯ ліҖмҲҳлҠ” мў…мҶҚліҖмҲҳмқё кұҙл¬јн”јн•ҙм•Ўмқҳ м§Җм—ӯлі„ м°ЁмқҙлҘј нҷ•мқён•ҳкё° мң„н•ҳм—¬ лҸ…лҰҪліҖмҲҳлЎң мӮ¬мҡ©н•ҳмҳҖмңјл©° Table 2мҷҖ к°ҷмқҙ м„ңмҡёнҠ№лі„мӢңмҷҖ 6к°ң кҙ‘м—ӯмӢң(л¶ҖмӮ°, лҢҖкө¬, мқёмІң, кҙ‘мЈј, лҢҖм „, мҡёмӮ°), м„ёмў…мӢң, кІҪкё°лҸ„, к°•мӣҗлҸ„, 충мІӯл¶ҒлҸ„, 충мІӯлӮЁлҸ„, м „лқјл¶ҒлҸ„, м „лқјлӮЁлҸ„, кІҪмғҒлӮЁлҸ„, м ңмЈјлҸ„лЎң кө¬л¶„н•ҳмҳҖлӢӨ.
л§Ҳм§Җл§үмқҖ мһ¬н•ҙмў…лҘҳ ліҖмҲҳмқҙлӢӨ. мқҙ ліҖмҲҳлҠ” мһ¬н•ҙмң нҳ•мңјлЎң к°•н’Қ, лҢҖм„Ө, нғңн’Қ, нҸӯн’Қ, нҸӯн’Қм„Ө, нҸӯн’Қмҡ°, нҳёмҡ°, нҳёмҡ°нғңн’Қ, нҳёмҡ°нҸӯн’ҚмңјлЎң кө¬л¶„лҗңлӢӨ. мқҙ мӨ‘ нҸӯн’Қ, нҸӯн’Қм„Ө, нҸӯн’Қмҡ°, нҳёмҡ°нғңн’Қ, нҳёмҡ°нҸӯн’ҚмқҖ 2001л…„ 2мӣ” мқҙнӣ„лЎң мһ¬н•ҙ л°ңмғқ кё°лЎқмқҙ мЎҙмһ¬н•ҳм§Җ м•Ҡм•„ нҳ„мһ¬ л°ңмғқн•ҳлҠ” мһҗм—°мһ¬н•ҙмқё к°•н’Қ, лҢҖм„Ө, нғңн’Қ, нҳёмҡ°лЎң мһҗлЈҢлҘј мһ¬л¶„лҘҳн•ҳм—¬ 분м„қм—җ мӮ¬мҡ©н•ҳмҳҖлӢӨ.
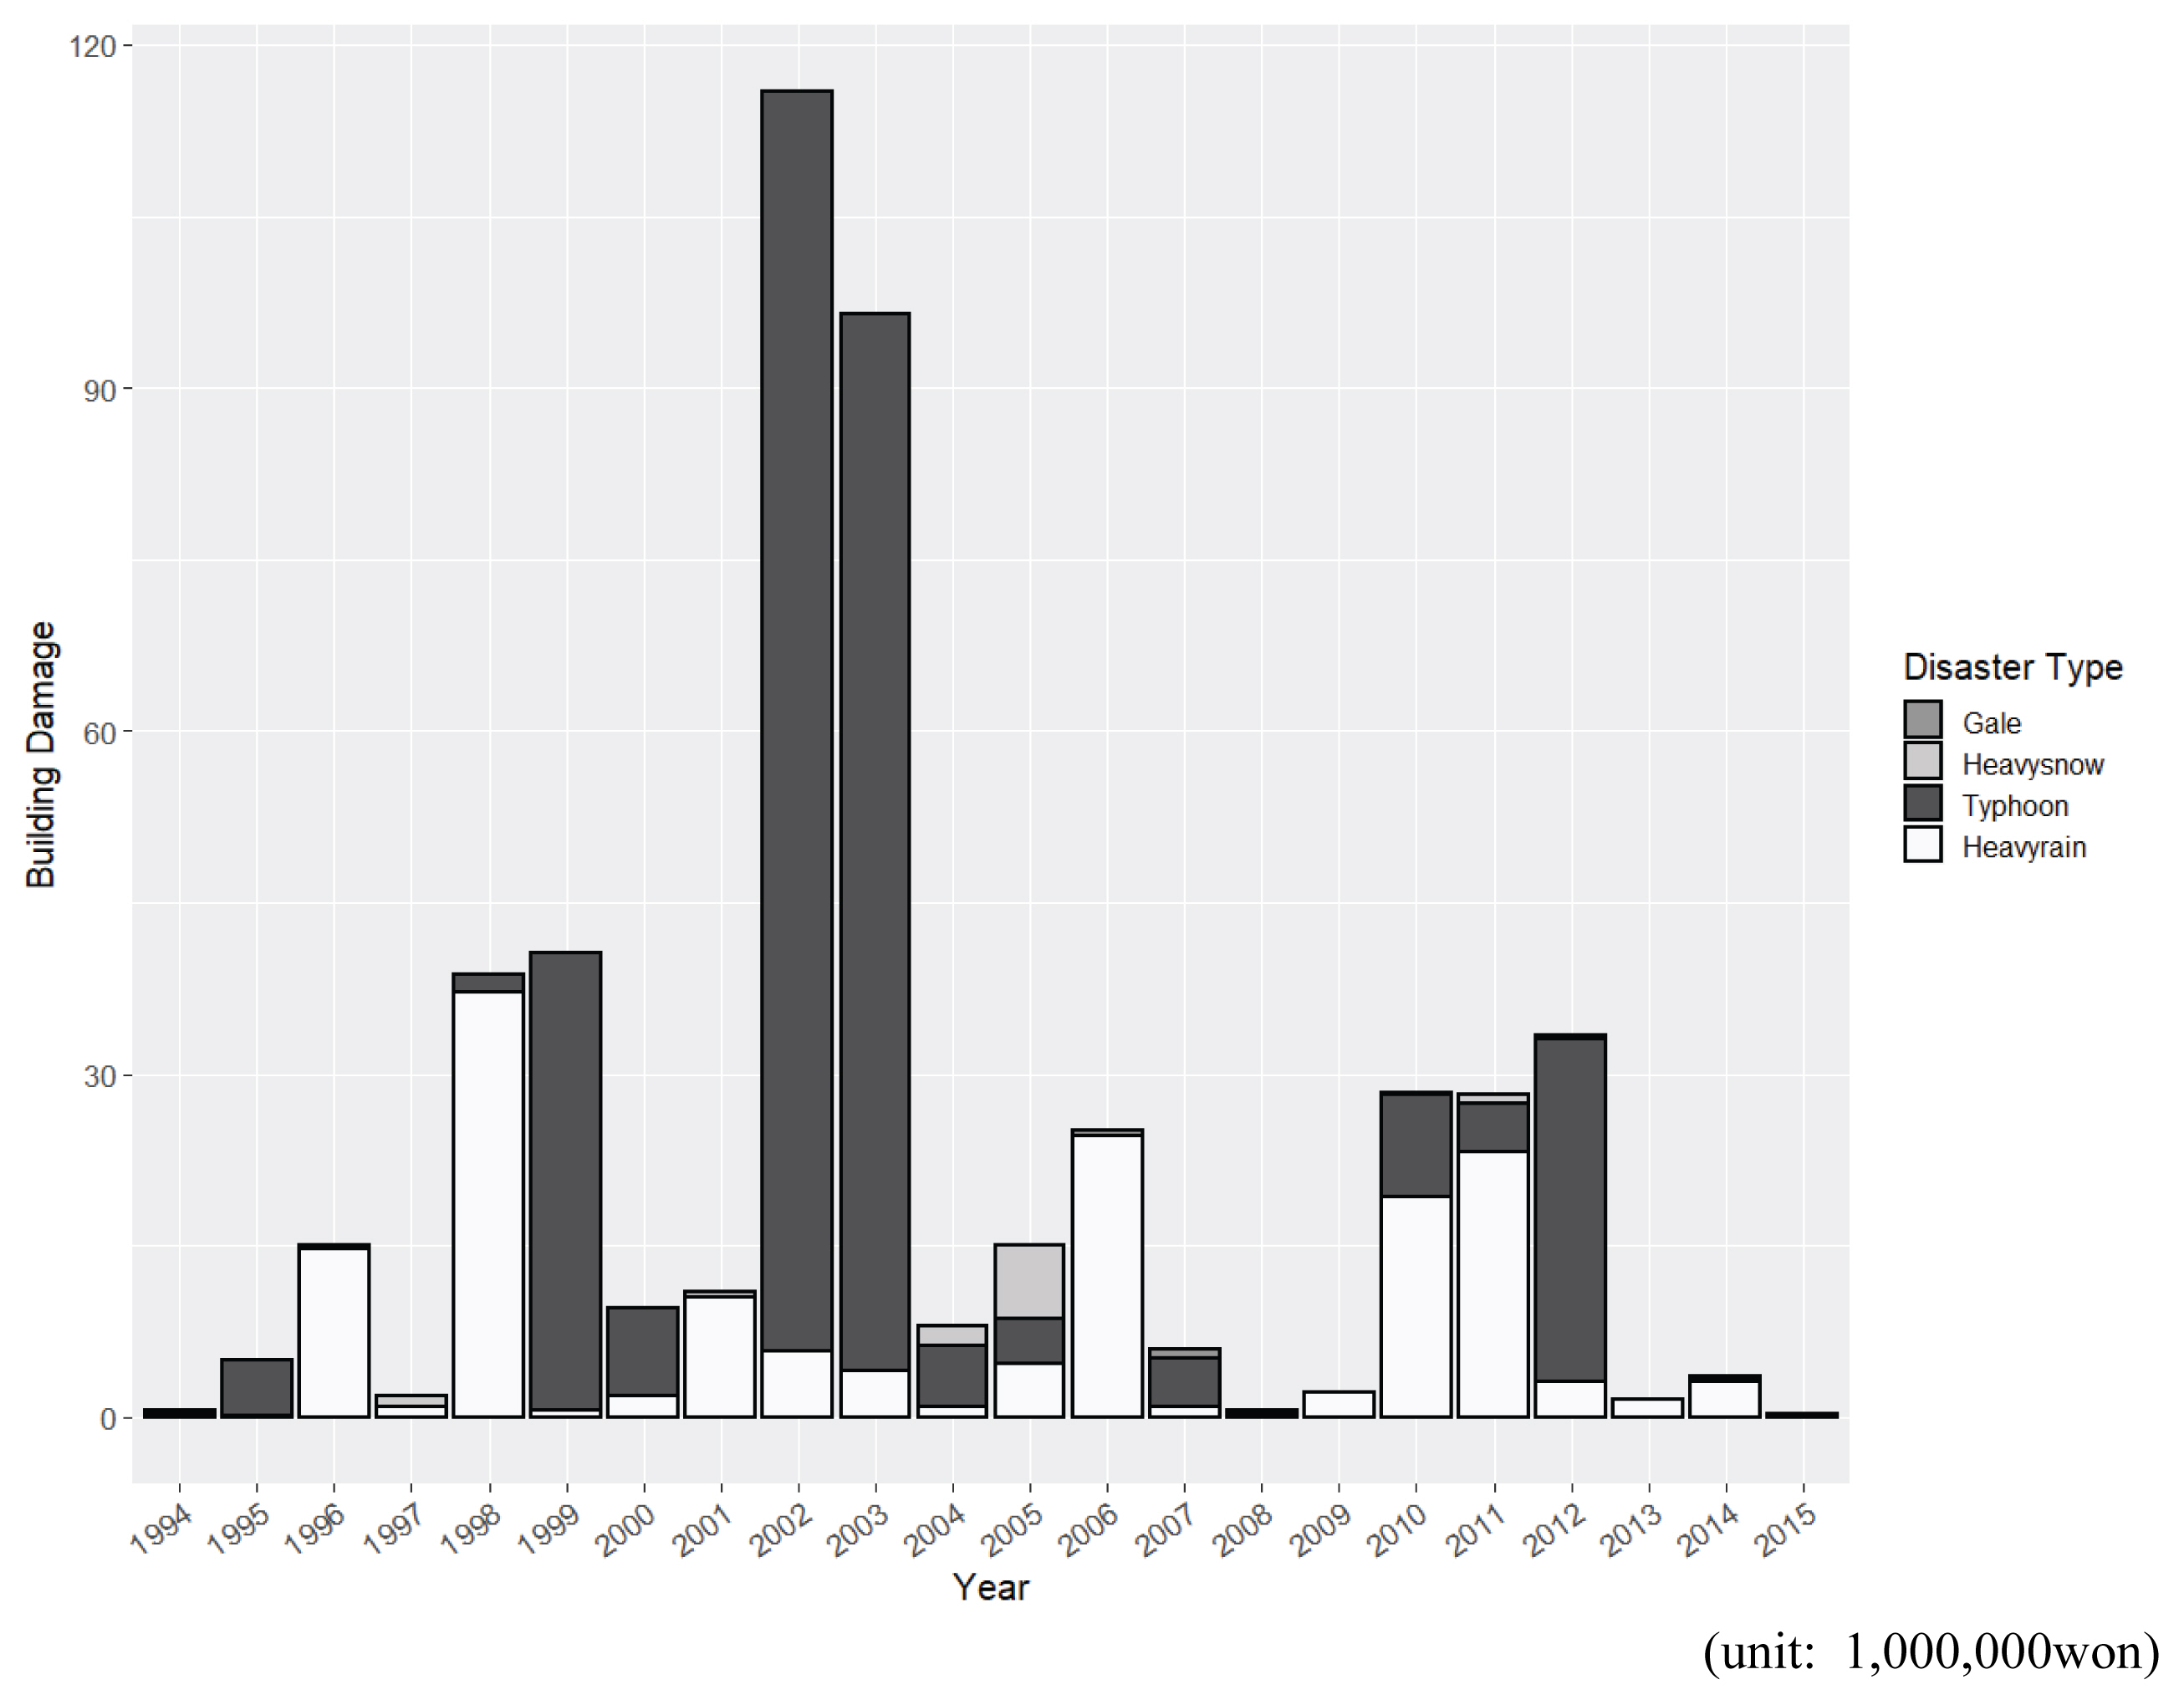
Table 3мқҖ мһҗм—°мһ¬н•ҙмң нҳ•лі„ мһ¬н•ҙмқҳ мӣҗмқёкіј мһ¬н•ҙкё°мӨҖкіј кҙҖл Ё мқёмһҗлҘј лӮҳнғҖлӮё кІғмқҙлӢӨ. мң„ н‘ңм—җ лӮҳнғҖлӮң мһҗм—°мһ¬н•ҙлі„лЎң кұҙл¬јм—җ л°ңмғқн•ҳлҠ” н”јн•ҙм•ЎмқҖ к°Ғкё° лӢӨлҘҙл©° Fig. 1мқҖ м—°лҸ„лі„ мһ¬н•ҙлЎң мқён•ң нҸүк· кұҙл¬јн”јн•ҙм•Ўмқ„ лӮҳнғҖлӮёлӢӨ. м§ҖлҰ¬м ҒвӢ…кё°нӣ„м Ғ нҠ№м§•мңјлЎң мқён•ҙ мһҘл§ҲлЎң мқён•ң нҳёмҡ°н”јн•ҙмҷҖ нғңн’Қм—җ мқҳн•ң н”јн•ҙк°Җ к°ҖмһҘ нҒ¬кІҢ лӮҳнғҖлӮҳлҠ” кІғмқ„ нҷ•мқён• мҲҳ мһҲмңјл©° нҠ№нһҲ 2002л…„кіј 2003л…„м—җлҠ” нғңн’Қ лЈЁмӮ¬мҷҖ л§ӨлҜёмқҳ мҳҒн–ҘмңјлЎң мқён•ҙ лӢӨлҘё кё°к°„ліҙлӢӨ нӣЁм”¬ л§ҺмқҖ кұҙл¬јн”јн•ҙк°Җ л°ңмғқн•ң кІғмқ„ нҷ•мқён• мҲҳ мһҲлӢӨ. нғңн’Қмқҙ л°ңмғқн•ҳм§Җ м•ҠмқҖ кё°к°„мқҖ нғңн’Қмқҙ л°ңмғқн•ң кё°к°„ліҙлӢӨлҠ” кұҙл¬јн”јн•ҙк°Җ м ҒкІҢ л°ңмғқн•ңлӢӨ. н•ңнҺё нҳёмҡ°лЎң мқён•ң кұҙл¬јн”јн•ҙлҠ” л§Өл…„ кҫёмӨҖнһҲ л°ңмғқн•ҳкі мһҲмңјл©° к°•н’Қкіј нҸӯм„ӨлЎң мқён•ң н”јн•ҙлҸ„ м§ҖмҶҚн•ҙм„ң л°ңмғқн•ңлӢӨ.
мһҗм—°мһ¬н•ҙлЎң мқён•ң н”јн•ҙлҠ” мһ¬н•ҙмў…лҘҳ(к°•н’Қ, лҢҖм„Ө, нғңн’Қ, нҳёмҡ°)лҝҗл§Ң м•„лӢҲлқј мһ¬н•ҙк°Җ л°ңмғқн•ҳлҠ” м§Җм—ӯм—җ л”°лқјм„ңлҸ„ м°ЁмқҙлҘј ліҙмқёлӢӨ. Table 4лҠ” м§Җм—ӯкіј мһ¬н•ҙмў…лҘҳм—җ л”°лҘё мһ¬н•ҙл°ңмғқкіј мһ¬н•ҙн”јн•ҙм•Ўм—җ кҙҖн•ң кё°мҙҲнҶөкі„лҘј лӮҳнғҖлӮё н‘ңмқҙлӢӨ. 0мқҙ кіјлҸ„н•ҳкІҢ нҸ¬н•Ёлҗң мһҗлЈҢмқҳ нҠ№м„ұмғҒ мһ¬н•ҙк°Җ л°ңмғқн•ң лӘЁл“ кІҪмҡ°мқҳ кё°мҙҲнҶөкі„лҹүкіј мһ¬н•ҙл°ңмғқ мӢң кұҙл¬јн”јн•ҙк°Җ л°ңмғқн•ң кІҪмҡ°мқҳ кё°мҙҲнҶөкі„лҹүмқ„ л”°лЎң н‘ңкё°н•ҳмҳҖлӢӨ.
кё°мҙҲнҶөкі„ кІ°кіј мӨ‘ лЁјм Җ м§Җм—ӯлі„ кұҙл¬јн”јн•ҙм•Ўмқҳ м°ЁмқҙлҘј нҷ•мқён•ҳл©ҙ м„ңмҡём§Җм—ӯмқ„ нҸ¬н•Ён•ң кҙ‘м—ӯмӢң м§Җм—ӯ(л¶ҖмӮ°, лҢҖкө¬, мқёмІң л“ұ)ліҙлӢӨ м§Җл°© м§Җм—ӯ(충л¶Ғ, 충лӮЁ, кІҪл¶Ғ л“ұ)мқҖ мһҗм—°мһ¬н•ҙмқҳ м§ҖмҶҚкё°к°„мқҖ нҒ¬кІҢ м°Ёмқҙк°Җ м—ҶмңјлӮҳ нҸүк· м Ғмқё кұҙл¬јн”јн•ҙм•ЎмқҖ нҒ° кІғмңјлЎң нҷ•мқёлҗҳм—ҲлӢӨ. лӢӨмқҢмңјлЎң мһ¬н•ҙмў…лҘҳлі„ кё°мҙҲнҶөкі„лҹүмқ„ нҷ•мқён•ң кІ°кіј к°ҖмһҘ л§Һмқҙ л°ңмғқн•ң мһ¬н•ҙлҠ” нҳёмҡ°мқҙм§Җл§Ң к°ҖмһҘ л§ҺмқҖ кұҙл¬јн”јн•ҙлҘј лҒјм№ң мһ¬н•ҙлҠ” нғңн’ҚмңјлЎң нҷ•мқёлҗҳм—ҲлӢӨ. к°•н’Қкіј лҢҖм„Өмһ¬н•ҙлҠ” лӢӨлҘё л‘җ мһ¬н•ҙм—җ 비н•ҙ л°ңмғқл№ҲлҸ„ лҢҖ비 кұҙл¬јн”јн•ҙлҘј лҒјм№ нҷ•лҘ мқҖ лӮ®мңјлӮҳ лҢҖм„Өмқҳ кІҪмҡ° кұҙл¬јн”јн•ҙк°Җ л°ңмғқн• мӢң нҳёмҡ°ліҙлӢӨ мҳӨнһҲл Ө лҚ” нҒ° кұҙл¬јн”јн•ҙлҘј лҒјм№ңлӢӨ. лҳҗн•ң, лҢҖм„ӨмқҖ лӘЁл“ мһ¬н•ҙ мӨ‘ к°ҖмһҘ кёҙ мһ¬н•ҙ кё°к°„мқ„ к°Җм§Җл©° мқҙлҠ” к°•м„Ө кё°к°„мқҙ мҰқк°Җн• мҲҳлЎқ м Ғм„Өлҹүмқҙ лҠҳм–ҙлӮҳлҠ” лҢҖм„Өмһ¬н•ҙмқҳ нҠ№м§•м—җ мқҳн•ң кІғмңјлЎң мҳҲмғҒлҗңлӢӨ.
4. 분м„қ л°Ҹ кІ°кіј
ліөн•©нҸ¬м•„мҶЎ лӘЁнҳ•кіј мҳҒкіјмһү ліөн•©нҸ¬м•„мҶЎ лӘЁнҳ•мқ„ мқҙмҡ©н•ҳм—¬ кұҙл¬јн”јн•ҙм•Ўм—җ лҢҖн•ҳм—¬ м–ҙл– н•ң ліҖмҲҳк°Җ мң мқҳн•ҳкІҢ мҳҒн–Ҙмқ„ лҜём№ҳлҠ”м§Җ м•Ңм•„ліҙкі мһҗ н•ңлӢӨ. 분м„қм—җ м•һм„ң мў…мҶҚліҖмҲҳмқё кұҙл¬јн”јн•ҙм•Ў Yмқҳ к°’мқҙ л§Өмҡ° нҒ¬кё° л•Ңл¬ём—җ л°ұл§Ңмӣҗ лӢЁмң„лЎң ліҖнҷҳн•ҳмҳҖмңјл©°, мқҙлҠ” ліөн•©нҸ¬м•„мҶЎ лӘЁнҳ•мқҙ Maximum Likelihood (ML) м¶”м •л°©лІ•мқ„ кё°л°ҳмңјлЎң лӘЁмҲҳлҘј м¶”м •н•ҳкё° л•Ңл¬ём—җ лӘЁмҲҳ м¶”м •мқ„ мң„н•ң кі„мӮ° кіјм • мӨ‘ кі„мӮ°мқҙ мҲҳл ҙлҗҳм§Җ м•ҠлҠ” л¬ём ңм җмқ„ ліҙмҷ„н•ҳкё° мң„н•ЁмқҙлӢӨ. 분м„қ л°Ҹ лӘЁмҲҳ м¶”м •мқ„ мң„н•ҳм—¬ нҶөкі„нҢЁнӮӨм§Җ Rмқ„ мӮ¬мҡ©н•ҳмҳҖмңјл©° лӘЁмҲҳ м¶”м •кІ°кіј, ліөн•©нҸ¬м•„мҶЎ лӘЁнҳ•мқҳ pмҷҖ П•м—җ лҢҖн•ң лӘЁмҲҳ м¶”м •к°’мқҖ к°Ғк°Ғ p ^ П• ^ p ^ П• ^
м§ҖмӢңлӘЁмҲҳмқё pк°’мқҙ 1кіј 2 мӮ¬мқҙм—җ мЎҙмһ¬н•ҳкё°м—җ кұҙл¬јн”јн•ҙм•Ўм—җ лҢҖн•ң мҳҒн–Ҙмҡ”мқёмқ„ нҷ•мқён•ҳкё° мң„н•ң л‘җ лӘЁнҳ•мқҳ мӮ¬мҡ©мқҖ м Ғн•©н•ҳлӢӨкі нҸүк°Җлҗҳм—ҲлӢӨ. н•ңнҺё л‘җ лӘЁнҳ•мқҳ 비көҗлҘј мң„н•ң нҢҗлӢЁ кё°мӨҖмңјлЎң AICлҘј мӮ¬мҡ©н•ҳмҳҖмңјл©° AICлҠ” лЎңк·ё к°ҖлҠҘлҸ„н•ЁмҲҳмҷҖ лӘЁнҳ•мқҳ лӘЁмҲҳмқҳ мҲҳлҘј лҚ”н•ң н•ЁмҲҳлЎң лӘЁмҲҳмқҳ мҲҳк°Җ л§Һмқ„мҲҳлЎқ м Ғн•© кІ°кіјм—җ нҺҳл„җнӢ°лҘј мЈјлҠ” л°©лІ•мқҙлӢӨ. л”°лқјм„ң AICмқҳ нҒ¬кё°к°Җ мһ‘мқ„мҲҳлЎқ м ңм•Ҳлҗң лӘЁнҳ•мқҙ мһҗлЈҢм—җ мһҳ м Ғн•©лҗң кІғмңјлЎң нҢҗлӢЁн• мҲҳ мһҲлӢӨ. AICмҷҖ лЎңк·ё к°ҖлҠҘлҸ„н•ЁмҲҳмқҳ мӢқмқҖ Eq. (8)кіј к°ҷлӢӨ(Akaike, 1973).
кұҙл¬јн”јн•ҙм•Ўмқ„ мў…мҶҚліҖмҲҳлЎң н•ҳм—¬ лӘЁл“ ліҖмҲҳлҘј л‘җ лӘЁнҳ•м—җ м Ғн•© мӢңмјң м–»м–ҙ진 кІ°кіјлҠ” Table 5м—җ м ңмӢңлҗҳм–ҙмһҲлӢӨ. Table 5 н•ҳлӢЁмқҳ ліөн•©нҸ¬м•„мҶЎ лӘЁнҳ•кіј мҳҒкіјмһү ліөн•©нҸ¬м•„мҶЎ лӘЁнҳ•мқҳ м¶”м •кІ°кіј AICлҘј 비көҗн–Ҳмқ„ л•Ң ліөн•©нҸ¬м•„мҶЎ лӘЁнҳ•мқҳ AICлҠ” вҖ“18808.69мқҙл©° мҳҒкіјмһү ліөн•©нҸ¬м•„мҶЎ лӘЁнҳ•мқҳ AICлҠ” -20465.57мқҙлӢӨ. мқҙлҠ” 0мқҙ кіјлҸ„н•ҳкІҢ нҸ¬н•Ёлҗң кұҙл¬јн”јн•ҙм•Ўкіј к°ҷмқҖ мһҗлЈҢм—җлҠ” мҳҒкіјмһү ліөн•©нҸ¬м•„мҶЎ лӘЁнҳ•мқ„ м Ғн•©н•ң кІғмқҙ нҶөкі„м ҒмңјлЎң лҚ” мң мқҳн•ҳлӢӨлҠ” кІғмқ„ мқҳлҜён•ңлӢӨ.
л‘ҳм§ёлЎң мҳҒкіјмһү ліөн•©нҸ¬м•„мҶЎ лӘЁнҳ•мқҳ кІ°кіјмқё Table 5мқҳ лӘЁнҳ• м¶”м • кІ°кіјм—җм„ңлҠ” кұҙл¬јн”јн•ҙм•Ўмқҙ 0мқҙ м•„лӢҢ мһҗлЈҢ мҰү кұҙл¬јн”јн•ҙм•Ўмқҙ мЎҙмһ¬н• л•Ңмқҳ мһҗлЈҢм—җ лҢҖн•ң мҳҒкіјмһү ліөн•©нҸ¬м•„мҶЎ лӘЁнҳ•м¶”м • кІ°кіјмҷҖ кұҙл¬јн”јн•ҙ л°ңмғқ м—¬л¶Җм—җ лҢҖн•ң мҳҒкіјмһү ліөн•©нҸ¬м•„мҶЎ лӘЁнҳ• м¶”м • кІ°кіјк°Җ н•Ёк»ҳ м ңмӢңлҗҳм–ҙмһҲлӢӨ.
кұҙл¬јн”јн•ҙ л°ңмғқ м—¬л¶Җм—җ лҢҖн•ң мҳҒкіјмһү ліөн•©нҸ¬м•„мҶЎ лӘЁнҳ•м¶”м • кІ°кіј мӨ‘ мң мқҳмҲҳмӨҖ 0.05м—җм„ң мң мқҳн•ң ліҖмҲҳмқҳ нҡҢк·Җкі„мҲҳлҘј мӮҙнҺҙліҙл©ҙ мһ¬н•ҙкё°к°„(Duration)мқҙ 1мқј мҰқк°Җ мӢң кұҙл¬јн”јн•ҙк°Җ л°ңмғқн•ҳм§Җ м•Ҡмқ„ нҷ•лҘ мқҖ нҸүк· м ҒмңјлЎң 93.32% (e-0.0691 = 0.9332)лЎң к°җмҶҢн•ңлӢӨ. мҰү мһ¬н•ҙкё°к°„мқҙ мҰқк°Җн• мҲҳлЎқ кұҙл¬јн”јн•ҙк°Җ л°ңмғқн• нҷ•лҘ мқҙ мҰқк°Җн•ҳлҠ” кІғмңјлЎң 분м„қлҗҳм—ҲлӢӨ. лҳҗн•ң, мһ¬н•ҙм§Җм—ӯмқҳ кё°мӨҖ мҲҳмӨҖмқё м„ңмҡём§Җм—ӯкіј мң мқҳн•ң м°ЁмқҙлҘј ліҙмқё м§Җм—ӯмқҖ лҢҖм „м§Җм—ӯмңјлЎң кұҙл¬јн”јн•ҙк°Җ л°ңмғқн•ҳм§Җ м•Ҡмқ„ нҷ•лҘ мқҙ м„ңмҡём§Җм—ӯкіј 비көҗн•ҳм—¬ 47.49% (e-0.3886 = 1.4749) мҰқк°Җн•ҳл©° лҢҖм „м§Җм—ӯмқ„ м ңмҷён•ң м§Җм—ӯмқҖ кұҙл¬јн”јн•ҙк°Җ л°ңмғқн• нҷ•лҘ мқҙ м„ңмҡём§Җм—ӯкіј м°Ёмқҙк°Җ лӮҳм§Җ м•ҠлҠ”лӢӨ. мқҙлҠ” мһ¬н•ҙлЎң мқён•ң кұҙл¬јн”јн•ҙ л°ңмғқ м—¬л¶ҖлҠ” м§Җм—ӯкіјлҠ” м—°кҙҖм„ұмқҙ нҒ¬м§Җ м•ҠмқҖ кІғмқ„ мқҳлҜён•ңлӢӨ. лҳҗ мһ¬н•ҙмў…лҘҳмқҳ кё°мӨҖ мҲҳмӨҖмқё к°•н’Қкіј мң мқҳн•ң м°ЁмқҙлҘј ліҙмқҙлҠ” мһ¬н•ҙлҠ” нғңн’Қ, нҳёмҡ°лЎң к°•н’Қкіј 비көҗн•ҳм—¬ кұҙл¬јн”јн•ҙк°Җ л°ңмғқн•ҳм§Җ м•Ҡмқ„ нҷ•лҘ мқҙ к°Ғк°Ғ 12.92% (e-2.046 = 0.1292), 9.24% (e-2.3811 = 0.0924)лЎң к°җмҶҢн•ңлӢӨ. мҰү нғңн’Қкіј нҳёмҡ° л°ңмғқ мӢң к°•н’Қкіј 비көҗн•ҳм—¬ кұҙл¬јн”јн•ҙк°Җ л°ңмғқн• нҷ•лҘ мқҙ кёүкІ©н•ҳкІҢ мҰқк°Җн•ҳлҜҖлЎң мқҙм—җ л”°лҘё лҢҖ비к°Җ н•„мҡ”н•ҳлӢӨ.
лӢӨмқҢмңјлЎң кұҙл¬јн”јн•ҙм•Ўмқҙ 0мқҙ м•„лӢҢ к°’мқ„ к°Җм§Ҳ л•Ңмқҳ мҳҒкіјмһүліөн•©нҸ¬м•„мҶЎ лӘЁнҳ•м¶”м • кІ°кіј мӨ‘ мң мқҳмҲҳмӨҖ 0.05м—җм„ң мң мқҳн•ң ліҖмҲҳмқҳ нҡҢк·Җкі„мҲҳлҘј мӮҙнҺҙліҙл©ҙ, кұҙл¬јн”јн•ҙм•ЎмқҖ мһ¬н•ҙкё°к°„мқҙ 1мқј мҰқк°Җ мӢң нҸүк· м ҒмңјлЎң 3.91% (e-0.0384 = 1.0391) мҰқк°Җн•ҳлҠ” кІғмңјлЎң 분м„қлҗҳм—ҲлӢӨ. лҳҗн•ң, мһ¬н•ҙм§Җм—ӯмқҳ кё°мӨҖ мҲҳмӨҖмқё м„ңмҡём§Җм—ӯм—җ 비н•ҙ лҢҖм „м§Җм—ӯмқҖ 46.25% (e-0.7711 = 0.4625) лӮ®мқҖ кұҙл¬јн”јн•ҙм•Ўмқ„ к°Җм§Ҳ кІғмңјлЎң 분м„қлҗҳл©° м„ёмў…, к°•мӣҗ, 충л¶Ғ, 충лӮЁ, м „л¶Ғ, м „лӮЁ, кІҪл¶Ғ м§Җм—ӯмқҖ к°Ғк°Ғ 206.6% (e1.1204 = 3.066), 127.91% (e0.8238 = 2.2791), 363.9% (e1.5345 = 4.639), 297.29% (e1.3795 = 3.9729), 253.77% (e1.2635 = 3.5377), 314.29% (e1.4214 = 4.1429), 175.13% (e1.0121 = 2.7513) лҶ’мқҖ кұҙл¬јн”јн•ҙм•Ўмқ„ к°Җм§Ҳ кІғмңјлЎң 분м„қлҗңлӢӨ. мқҙлҠ” м§Җл°© м§Җм—ӯмқҙ мһ¬н•ҙлЎң мқён•ң н”јн•ҙк°Җ лҚ” нҒ¬кІҢ лӮҳнғҖлӮҳлҠ” кІғмқ„ мқҳлҜён•ңлӢӨ.
분м„қкІ°кіј, лҢҖм „мқ„ м ңмҷён•ң 충мІӯм§Җм—ӯ(м„ёмў…, 충л¶Ғ, 충лӮЁ)мқҖ кұҙл¬јн”јн•ҙ л°ңмғқнҷ•лҘ мқҙ м „л°ҳм ҒмңјлЎң л§Өмҡ° лҶ’кі , к°•мӣҗ л°Ҹ кІҪмғҒм§Җм—ӯмқҖ мғҒлҢҖм ҒмңјлЎң лӮ®мқҖ кІғмңјлЎң лӮҳнғҖлӮ¬лҠ”лҚ°, мқҙлҹ¬н•ң м§Җм—ӯм Ғ м°ЁмқҙлҠ” мғҒлӢ№нһҲ мЈјлӘ©н•ҙм•ј н• нҳ„мғҒмңјлЎң нҢҗлӢЁлҗңлӢӨ. мқҙмҷҖ к°ҷмқҖ кІ°кіјлҠ” мҶҢл“қмҲҳмӨҖкіј мһҗм—°мһ¬н•ҙ н”јн•ҙм•Ўкіјмқҳ кҙҖкі„м„ұмқ„ 분м„қн•ң мқҙм „мқҳ м—°кө¬кІ°кіјмҷҖ к°ҷмқҙ, м„ңмҡём§Җм—ӯліҙлӢӨ м§Җл°© м§Җм—ӯмқҳ мһ¬н•ҙмҳҲл°© мӢңм„Ө л°Ҹ м„Ө비 л¶ҖмЎұ, кұҙл¬ј л…ёнӣ„нҳ„мғҒм—җ лҢҖн•ң л°ҳмҰқмңјлЎң ліҙмқёлӢӨ(Kim et al., 2017).
л§Ҳм§Җл§үмңјлЎң мһ¬н•ҙмў…лҘҳмқҳ кё°мӨҖ мҲҳмӨҖмқё к°•н’Қм—җ 비н•ҙ нғңн’ҚмқҖ 52.97% (e1.5513 = 1.5297) лҶ’мқҖ кұҙл¬јн”јн•ҙм•Ўмқ„ к°Җм§Ҳ кІғмңјлЎң 분м„қлҗңлӢӨ. нҠ№мқҙн•ҳкІҢ к°•н’ҚліҙлӢӨ нҳёмҡ°лЎң мқён•ҙ л§Өмҡ° нҒ° кұҙл¬јн”јн•ҙм•Ўмқҙ л°ңмғқн• кІғмңјлЎң м¶”м •лҗң ліөн•©нҸ¬м•„мҶЎ лӘЁнҳ• м¶”м •кІ°кіјмҷҖлҠ” лӢ¬лҰ¬, мҳҒкіјмһү ліөн•©нҸ¬м•„мҶЎ м¶”м •кІ°кіј кұҙл¬јн”јн•ҙк°Җ л°ңмғқн• кІҪмҡ° нҳёмҡ°лҠ” к°•н’ҚлҢҖ비 кұҙл¬јн”јн•ҙм•Ўм—җ мң мқҳлҜён•ң м°ЁмқҙлҘј ліҙмқҙм§Җ м•ҠлҠ”лӢӨкі л¶„м„қлҗҳм—ҲлӢӨ.
5. кІ° лЎ
ліё м—°кө¬лҠ” мһҗлЈҢмқҳ нҠ№м„ұмңјлЎң мқён•ҙ лӘЁнҳ• м Ғн•©мқҙ м–ҙл Өмҡҙ мһ¬н•ҙн”јн•ҙм•Ў мӨ‘ кұҙл¬јн”јн•ҙм•Ўм—җ лҢҖн•ҙ ліөн•©нҸ¬м•„мҶЎ лӘЁнҳ•кіј 0мқҳ мһҗлЈҢк°Җ кіјмһүлҗң мһҗлЈҢмқҳ нҠ№м„ұмқ„ л°ҳмҳҒн• мҲҳ мһҲлҠ” мҳҒкіјмһү ліөн•©нҸ¬м•„мҶЎ лӘЁнҳ•мқ„ м Ғн•©мӢңмјң, ліҙлӢӨ мҡ°мҲҳн•ң лӘЁнҳ•мқ„ м„ нғқн•ҳкі н•ҙлӢ№ лӘЁнҳ•мқҳ кІ°кіјлҘј нҶөн•ҙ кұҙл¬јн”јн•ҙм•Ўм—җ мҳҒн–Ҙмқ„ мЈјлҠ” мһ¬н•ҙмў…лҘҳмҷҖ мһ¬н•ҙм§Җм—ӯмқ„ нҷ•мқён•ҳмҳҖлӢӨ. мқҙлҘј нҶөн•ҙ кұҙл¬јн”јн•ҙлҘј мөңмҶҢлЎң н• мҲҳ мһҲлҠ” м§Җм—ӯлі„ м°Ёл“ұм Ғмқё мһ¬н•ҙлҢҖмқ‘м •мұ… л§Ҳл Ёмқҳ н•„мҡ”м„ұмқ„ м ңмӢңн•ҳмҳҖлӢӨ.
ліё м—°кө¬м—җм„ңлҠ” мһ¬н•ҙм§Җм—ӯ, мһ¬н•ҙкё°к°„, мһ¬н•ҙмў…лҘҳлҘј лҸ…лҰҪліҖмҲҳлЎң н•ҳм—¬ 1994л…„л¶Җн„° 2015л…„к№Ңм§Җ л°ңмғқн•ң мһҗм—°мһ¬н•ҙлЎң мқён•ң кұҙл¬јн”јн•ҙм•Ўм—җ лҢҖн•ҳм—¬ ліөн•©нҸ¬м•„мҶЎ лӘЁнҳ• л°Ҹ мҳҒкіјмһү ліөн•©нҸ¬м•„мҶЎ лӘЁнҳ•мқ„ нҷңмҡ©н•ҳм—¬ к°Ғ ліҖмҲҳмқҳ кі„мҲҳлҘј м¶”м •н•ҳмҳҖлӢӨ. лӘЁнҳ• м¶”м •кІ°кіј 0 кіјмһүмқҳ нҠ№м„ұмқ„ л°ҳмҳҒн• мҲҳ мһҲлҠ” мҳҒкіјмһү ліөн•©нҸ¬м•„мҶЎ лӘЁнҳ•мқҙ лҚ” нғҖлӢ№н•ң лӘЁнҳ•мһ„мқ„ нҷ•мқён•ҳмҳҖлӢӨ. м„ёл¶Җ кІ°кіјлҘј мӮҙнҺҙліҙл©ҙ, мҳҒкіјмһү ліөн•©нҸ¬м•„мҶЎ лӘЁнҳ•мқҳ кІ°кіј мӨ‘ кұҙл¬јн”јн•ҙ л°ңмғқ м—¬л¶Җм—җ кҙҖн•ң м¶”м •кІ°кіјм—җм„ң нғңн’Қкіј нҳёмҡ°лҠ” к°•н’Қмқ„ кё°мӨҖмңјлЎң л§Өмҡ° лҶ’мқҖ нҷ•лҘ лЎң кұҙл¬јн”јн•ҙк°Җ л°ңмғқн•ҳлҠ” кІғмңјлЎң 분м„қлҗҳм—ҲлӢӨ. л”°лқјм„ң нғңн’Қкіј нҳёмҡ°мқҳ кІҪмҡ°, мғҒлҢҖм ҒмңјлЎң мӢ¬к°Ғн•ң кұҙл¬јмқҳ н”јн•ҙк°Җ мҡ°л ӨлҗҳлҜҖлЎң мқҙлҘј кІҪк°җн• мҲҳ мһҲлҠ” мІ м Җн•ң мҳҲл°© л°Ҹ лҢҖмқ‘ лҢҖмұ… л§Ҳл Ёмқҙ н•„мҡ”н• кІғмңјлЎң ліҙмқёлӢӨ.
м•„мҡёлҹ¬ м„ңмҡём§Җм—ӯ ліҙлӢӨ м§Җл°©мқҖ мһҗм—°мһ¬н•ҙм—җ мқҳн•ң кұҙл¬јн”јн•ҙм•Ўмқҙ мҰқк°Җн• кІғмңјлЎң мҳҲмғҒлҗҳлҜҖлЎң м§Җл°©мқҳ кұҙл¬јн”јн•ҙ м Җк°җл°©м•Ҳм—җ кҙҖн•ң м—°кө¬мӮ¬м—…, мһ¬н•ҙмҳҲл°© м •мұ… л°Ҹ м „лһө л§Ҳл Ёмқҙ н•„мҡ”н• кІғмңјлЎң нҢҗлӢЁлҗңлӢӨ. лҳҗн•ң мһ¬н•ҙкё°к°„мқҙ кёём–ҙм§ҲмҲҳлЎқ кұҙл¬јн”јн•ҙм•Ўмқҙ мҰқк°Җн•ҳлҜҖлЎң мһ¬н•ҙкё°к°„м—җ л”°лҘё лҢҖмұ…л§Ҳл Ёкіј н•Ёк»ҳ, н–Ҙнӣ„ мһ¬лӮңмң л°ңмҡ”мқёмқҳ к°•лҸ„мҷҖ м—°кі„н•ҳм—¬ к·ё н”јн•ҙм •лҸ„лҘј мҳҲмёЎн•ҳлҠ” м—°кө¬лҸ„ н•„мҡ”н• кІғмңјлЎң нҢҗлӢЁлҗңлӢӨ.
비лЎқ ліё м—°кө¬к°Җ мһҗм—°мһ¬н•ҙ н”јн•ҙм•Ўмқҙ м§ҖлӢҲлҠ” нҠ№лі„н•ң мһҗлЈҢ분нҸ¬ нҠ№м„ұмқ„ л°ҳмҳҒн•ҳм—¬ лӘЁнҳ•мқ„ м Ғн•©мӢңнӮҙмңјлЎңмҚЁ мқҳлҜё мһҲлҠ” кІ°кіјлҘј м–»м—ҲмңјлӮҳ, мһ¬н•ҙм—°ліҙм—җ мҲҳлЎқлҗң н”јн•ҙм•Ўмқҙ мӢӨм ң мһ¬мӮ°н”јн•ҙм•ЎкіјлҠ” мғҒмқҙн•Ём—җ л”°лҘё к·јліём Ғмқё н•ңкі„к°Җ мЎҙмһ¬н•ңлӢӨ. нҳ„мһ¬ көӯк°Җм—°кө¬к°ңл°ңкіјм ңлЎң мӢӨм ң н”јн•ҙм•Ўмқ„ кіјн•ҷм ҒмңјлЎң мЎ°мӮ¬н•ҳкі н•©лҰ¬м ҒмңјлЎң м¶”м •н•ҳлҠ” кё°лІ•мқҙ м—°кө¬ к°ңл°ңлҗҳкі мһҲмңјлҜҖлЎң мқҙ кІ°кіјлҘј м Ғмҡ©н•ҳм—¬ мғҲлЎңмҡҙ лӘЁнҳ•мқҙ м¶”м •лҗ н•„мҡ”к°Җ мһҲлӢӨ.
лҳҗн•ң ліё м—°кө¬лҠ” 분м„қмқҙ кҙ‘м—ӯмӢңвӢ…лҸ„ м°Ёмӣҗм—җм„ңл§Ң мқҙлЈЁм–ҙмЎҢлӢӨлҠ” кІғкіј кұҙл¬јн”јн•ҙм—җ мӨ‘мҡ”н•ң мҳҒн–Ҙмқ„ лҜём№ҳлҠ” к°•мҡ°лҹү, к°•мҡ°к°•лҸ„, н’ҚмҶҚ л“ұмқҳ кё°мғҒнҳ„мғҒ, кұҙл¬јмқҳ кө¬мЎ° л°Ҹ л…ёнӣ„лҸ„ л“ұмқҳ мЈјмҡ” мқёмһҗк°Җ кі л Өлҗҳм§Җ лӘ»н–ҲлӢӨлҠ” н•ңкі„м җмқҙ мһҲлӢӨ. мқҙлҠ” м—°кө¬мқҳ н•ңкі„м җмқё лҸҷмӢңм—җ, мқҙлҘј ліҙмҷ„н•ҳм—¬ 추к°Җм Ғмқё м—°кө¬мҲҳн–үмқҙ н•„мҡ”н•ҳлӢӨлҠ” кІғмқ„ мӢңмӮ¬н•ңлӢӨ. м•„мҡёлҹ¬ ліё м—°кө¬лҠ” н”јн•ҙм•Ўм—җ кҙҖн•ң м„ӨлӘ…лӘЁнҳ•м—җ көӯн•ңлҗҳм–ҙ мһҲмңјлҜҖлЎң, н–Ҙнӣ„ мқёкіјкҙҖкі„ лӘЁнҳ•мңјлЎң л°ңм „мӢңнӮӨкё° мң„н•ң м§ҖмҶҚм Ғмқё м—°кө¬к°Җ н•„мҡ”н• кІғмңјлЎң нҢҗлӢЁлҗңлӢӨ.